| GISdevelopment.net ---> AARS ---> ACRS 1997 ---> Poster Session 2 |
The Usefulness of Radarsat
for Monitoring Land Use Change in the Multimedia Super Corridor, Malaysia
Judibal C.C.1
Kamaruzaman J.2 Marghany, M.M3
1Faculty of Forestry - UPM
2 Faculty of Forestry - UPM
3Faculty of Engineering - UPM
Abstract 1Faculty of Forestry - UPM
2 Faculty of Forestry - UPM
3Faculty of Engineering - UPM
The Multimedia Super Corridor (MSC), which includes University Putra Malaysia (UPM) and Serdang township was studied using radarsat data. The ESAI/PCI software was used to discriminate land use alteration cover from the EASI/PC software that discriminates vegetation alteration cover from the other cover types, and provides rate of vegetation cover in the area. This quantitative analysis using overlay techniques provides an excellent strategy for monitoring land use change in the study area. A supervised classification was used to examine the spatial impact of incorporating topography in the classification. This involved a classification and mapping of the entire study area using Radarsat data and topographic descriptors extracted from an interpolated digital elevation model (DEM) for all pixels in the study area. The results provide evidence that Radarsat and topographic data sets derived form DEM can be integrated in order to estimate rate of change on the green cover area. The combined analysis of the vegetation data showed that some forms of degradation has taken place through a few years ago.
Introduction
Accurate and up to date earth surface or terrain information is a common requirement of scientists in a wide range of disciplines since the nature of the surface affects the practical use of land. Foresters, ecologists, engineers, geographers, and other concerned decision making and planning. Information requirements include measurement of attributes may describe the vegetation type and composition at a site or the topography in the form of slope, aspect or elevation.
Quantitative analysis of terrain is gaining increasing importance as a component of spatial modelling in Remote Sensing and geographic information systems (GIS). The objective of such quantitative analysis is to assign a relevant description to all elements in a digital terrain model, with the objective of the terrain (Evans, 1979), but because of technical difficulties in producing and integrating such data with other information, it has only been utilized for a limited set of applications.
Paper presented at the 18th. Asian Conference on Remote Sensing. 20-25 October 1997. Kuala Lumpur, Malaysia.
DEMs are similar ot Radarsat data in that thay are quantitative representations of tye earth surface; however, each number in the model represents terrain elevations at knoqwn positions rather than spectral intensities (BURROUGH,1986). Such models can be generated independently from ground survey (Brinker and Wolf, 1984), topographic maps (Collins, 1975), aerial photography (Crawley, 1974), or most recently, geographic information systems (GIS) (WEIBEL and DeLotto, 1989). The application of DEM data in digital terrain classification has been proposed and attempted for MSS by Hutchinson (1978) and TM data by Moulton (1989); efforts has been documented using radar imagery in a subartic environment, although several researches (for example, Walsh, 1987) have pointed out the value of this approach of Radarsat. Several systems for automated terrain classification have already been reported been reported by (Pike (1988) and Mark (1975)).
However, they all lack a certain breath of the approach and therefore do not yield optimal results. The objective of this paper is to determine whether or not a data set composed of topographic terrain descriptors can lead to an improved classification if integrated with supervised classification by Radarsat data.
Methodology
Satellite Data
Radarsat data (fine mode) of Kuala Lumpur was taken on 07 January 1996 at 22:49:41.070 GM time. The data is located between 20 88' N to 3 40' and 1010 55'E to 1010 98'E. For the purpose of the study, sub-scenes of about 305 by 320 pixels of the study area were selected. It is located between 20 88' N to 30 05' N latitude and between 1010 41 'E to 1010 45'E Longitude.
Digital Image Processing
Textures and Filtering Analysis
The Radarsat image data were loaded into the PCI EASI/PAC image processing system. A subset image was later selected by image subset command. Digital image processing steps included textures analysis and speckle filtering The image processing analysis has conducted based on Maged et alkalinity. 1996.
DEM Analysis
Topographic map were digitized by using AutoCAD version 12. The digitizing data was then loaded to PCI EASI/ PAC and later converted into digital data to raster data in order to create DEM which was late converted to 3D DEM. Finally, the raster data was overlaid on the textures analysis on Radarsat image. The main purpose of this procedure is to determine the change of DEM since 1981 to 1996.
Supervised Classification
Different sets of classes was used to processes image classifications. These classes were selected based on the information obtained from the topographic map of study area. The statistical calculation of the classes was obtained automatically by PCI EASI/PAC software. Two types of classification were performed. The first step was to determine statistically it traditional information is available from the topographic data set. This requires a systematic analysis of the relationships between supervised classification acquired by Radarsat and the topographic component of terrain in the region selected for this study.
The next step was to determine the statistical improvement in landscape or terrain classification accuracy that can be achieved by integrating supervised classification and topographic data. The statistical analysis was based on a discriminant function derived from supervised classification, topographic data alone and a combination of supervised classification and topographic data set. Finally a spatial analysis of the integration of supervised classification and topographic data in the form of a map product was conducted.
Results and Discussion
Spatial Analysis
Maps of the distribution of terrain classes are presented in figures 1 and figures 2. Figure 1 was produced based on the topography data alone by applying rasterization while Figures 2 illustrated the 3 D of digital elevation model.
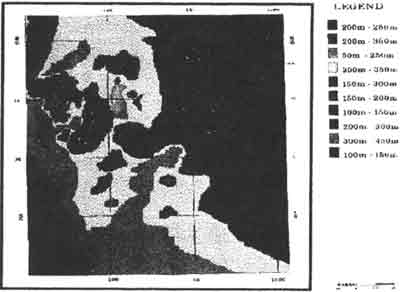
Figure 1: DEM extracted from topographic map
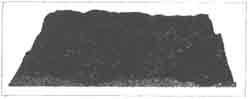
Figure 2: 3D-DEM of the study area
Some spatial effects of incorporating geomorphometric parameters in the classification are immediately obvious when comparing the two maps. The most evident is in the spatial distribution of elevations where it varied from the east to west with highest environment (300m- 450m) concentrated on the north-east of study area with 300 to 400m . A similar findings are observed on Figure 2 which it is clear that the vegetation covers are concentrated on the lower limits of elevation. This is located on the north-west of study area. Figure 3 shows the DEM results overlaid with textures analysis's results of Radarsat. It is observed that the vegetation covers are around urban zone and highway are compared to south-west area of the valley. These results are similar to the supervised classifications results (Figure 4). Using geomorphometric parameters to discriminate classes, the problem is eliminated and water/lakes are correctly mapped only in the valleys. However, areas along the plains are spectrally similar to those in the valleys due to the vegetation composition which is primarily virgin forest and palm oil, despite this clearly illustrates that topographic information is a necessary if the class is to be mapped successfully in this region.
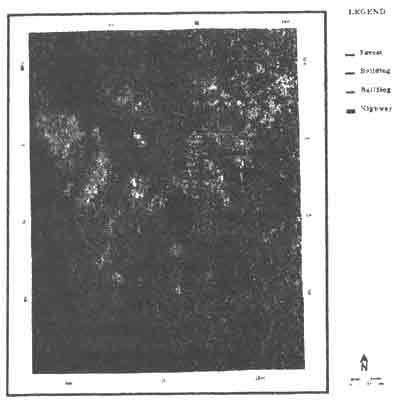
Figure 3: DEM overlaid with textures analysis
Another variation between the two maps (Figure 1 and Figure 4) occurs in the northern part in area referred as the urban zone as housing, highway and house court. The highest elevation in the area is 300m. This is far below the lower limit of elevation for an area to be classified as building in this area. When elevation and the other geomorphometric parameters are included are included in the classification, this area is correctly identified as urban area.
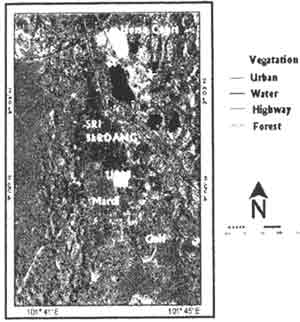
Figure 4: Supervised classification of Radarsat image
A third observable difference between the two maps is in the level of homogeneity of classes. In Figure 4, small local variations in supervise3d classifications show up as different classes. The standard deviation of vegetation cover was found less in Sri Serding as compared with urban building (Table 1).
| Classes | Standard Deviation |
| Vegetation | 50.50 |
| Forest | 34.60 |
| Urban | 52.94 |
| Lakes | 30.23 |
Moulton (1989) investigated the vegetation covers change on satellite Remote Sensing data by more advanced sensor. Environmental variables related to terrain features were found to have a significant effect on the data because changes in elevation or topographic relief was presented in the area investigated. Further 5the results above are similar to results obtained by Collins (1975) and Crawley (1974). They found that DEM elevation can be easily generated from topographic map information.
Conclusion
General conclusions can be derived as follows:
- There are significant relationships between surface cover and technology. DEM are useful for urban planning purposes.
- An integrated data set composed of topographic and sensor data can be employed to improve classification the vegetation cover has changed with a rate 45% since 1981 to 1996. Furthermore, the integration of DEM results and Radarsat data suggested than the urban zone are developed since 1981 to 1996.
The authors would like to thank the Environment. Khurial Nizar and Mis Mazna S. for their assistance for DEM creations.
References
- Brinker, R.C. and Wolf, P.R. 174. Elementary Surveying. New York: Happer and Row. 608p.
- Burrough, P.A.1986. Principles of Geographic Information Systems for Land Resource Assessment Monographs on Soil Resource Survey. No.12 Oxford: Claendon press 193p.
- Collins, S.H. 1975. Terrain Parameters Directly from a Digital Terrain Model. Canadian Surveyor, 9(5):507-518.
- Crawly, B.G. 1974. Gestalt countours. Canadian Surveyor, 28(3):237-246.
- Evans, I.S. 1979. An Integrated System of Terrain Analysis and Slope Mapping, Final report on DA-ERO-591-73-g0040: "Statistical Characterization of Altitude Matrices by Computer", Department of Geography, University of Durhan, 192p.
- Hutchinson, C.F. 1978 The Digital Use of Landsat Data for Integrated Land Resource Survey: A study in the Eastern Mojave Desert, California. Doctoral dissertation, University of California, Riverside, 265p.
- Maged, M.M. Mansour, S., and Ibrahim, Z. 1996. On the Application of Radarsat to Extract Infrastructure Details from Radarsat. In Proceeding of the First Malaysian Remote Sensing Society Conference. pp. F1-F11.
- Mark, D.M. 1975. Geomorphometric Parameters: A Review and Evaluation, Geografiska Annaler, 57A,3-4, pp. 165-177.
- Moulton, J.E. 1989. Terrain Classification Using Landsat TM and Digital Topographic Data in the Burwash Uplands Southwest Yukon. Department of Geography, University of Newfoundland, 116p.
- Pike, R.J. 19\88. Towards Geometric Signatures for Geographic Information Systems. Proceeding International Symposium on GIS (IGIS 1987), pp. 89-103.
- Speight, J. G. 1977. Landform Pattern Description from Aerial Photographs, Photogrammetria, 32: 161-182.
- Walsh, S. 1987. Variability of Landsat MSS Spectral Responses of Forests in Relation to Stand and Site Characteristics. International Journal of Remote Sensing, 8(9): 1289-1299.
- Weibel, R. and DeLotto, J.S. 1989. Automated Terrain Classification for GIS Modelling Geo-Processing Series: Contribution To Digital terrain Modelling and Display. Department of Geography, University of Zurich, pp. 25-50.