| GISdevelopment.net ---> AARS ---> ACRS 1997 ---> Poster Session 1 |
Characteristics Analysis of
Water Body in Tidal land Reclamation Area using Landsat TM Image data
Takashi Hoshi1,
Kiyoshi Torii2, Moon Soo
Choi3
1Department of computer & Information sciences, Faculty of Engineering
Ibaraki University, 4-15-1 Nakanarusawa, Hitachi, 316, JAPAN
2Department of Environmental Sciences & Technology, Graduate School of agriculture,
Kyoto University, Kitashirakawa, Sakyo ,Kyoto,606-01, JAPAN
3Graduate school of Science and Engineering, Ibaraki University,
4-12-1, Nakanarusawsa , Hitachi, 316, JAPAN
Abstract 1Department of computer & Information sciences, Faculty of Engineering
Ibaraki University, 4-15-1 Nakanarusawa, Hitachi, 316, JAPAN
2Department of Environmental Sciences & Technology, Graduate School of agriculture,
Kyoto University, Kitashirakawa, Sakyo ,Kyoto,606-01, JAPAN
3Graduate school of Science and Engineering, Ibaraki University,
4-12-1, Nakanarusawsa , Hitachi, 316, JAPAN
This study is to monitor what will occur including the land use and environment in the areas with the progress of Yougsan river comprehensive agricultural development projects stage (III) located in the southwestern coast of Korean peninsula . this study analyzes the characteristics of sea water and fresh water freshening reservoir using two kinds of satellite image data taken in different times on Yngsan river 3rd stages, under construction. The image processing was carried out geometric correction and unsupervised classification. As a result, band1, band1,2 and 3 are applicable to the analysis of the shades and water quality in the freshening reservoir. And, it was also shown fundamental knowledge to extract more detailed information .
1. Introduction
In the eastern coast of Korea, there exist tidal flats vastly developed with wide gasps between the high and low tides . these areas are suitable for tideland reclamation and the comprehensive tidal land reclamation projects have been implemented for satisfying the demand of land and water resources increased since the beginning of 1970s. however, the change of tide and land use by practicing tideland reclamation project influences the environment in the area. Especially in the freshening reservoir, the water pollution by influent sewage form the upper stream and the changes of ecosystem by desalting is an important problem to solve in the development of freshening reservoir.
The purpose of this study is to analyze what will occur including the land use and environment in the area with the progress of tideland reclamation project. This study analyzes the characteristics of sea water and fresh water of freshening reservoir using two kinds of satellite image data taken in different times on Yongsan river 3rd stages, under construction . it also includes characteristic investigation of reclaimed ldn and reclamation project. The satellite imagte processing carried out a geometric correction and profile extraction, unsupervised classification. Finally, this paper discusses variables and water quality pattern to classify sea water and fresh water from image data.
2. Study Area and Outlines of Projects
The study area of the present paper is Yougsan river comprehensive agricultural development projects stage (III), located in the southwestern coast of Korean peninsula ( fig. 2.1) this is an integrated project for agricultural development including two freshening reservoir and the water area reclaimed land, land reclamation and so on. The enclosure of two gulfs for the construction of freshening reservoir was completed for Yongam lake on April 8,1991 and for Kum lake on March 24,1994. at present, the desalination of lakes are progressing both by introducing fresh water form Yongsan river estuary lake in the adjacent second stage to Yongam lake and by closing Yongam lake and kum lake, but the connection canal to Kum lake to progress freshening process has not been completed.
Fig. 2.1 Location of Study area
The Yongsan river estuary lake was completed the construction of enclosure dike on February 28, 1981. the water resources f desalted reservoir with 253.2 million m3 storage capacity has been utilized for agricultural, industrial and urban uses.
In this district, the length of the enclosure dike for Yongam lake is 2.2 km the water resources to be developed by desalination is 153 million m3 and the area of water reclaimed land is 6,730ha. The length of the enclosure dike for Kum lake is 2.1km, the water resources to be developed is 75 million m3 and the area of water land reclamation is 3,770ha. The major works of this district are presented in table 2.1.
| Destinction | Total | III- 1 stage | III- 2 stage |
| Development Area | 19,000ha | 12,200ha | 6,800ha |
| Tideland recla. | 10,500ha | 6,730 | 3.770ha |
| Irrigation Impro. | 8,500ha | 5,470 | 3,030ha |
| Sea-Dike | 3Places 4.3km | 1 place 2.2 km | 2 Places 2.1 km |
| Sluice gate | 3 Places | 1 Place | 2 Places |
| Connec. Canal | 3 Places | 8 Places | 5 Places |
| Pumping St. | 13 Places | 8 Places | 5 Places |
| Irrigation Canel | 39 Places 285 km | 21 Places 180 km | 18 Places km |
The huge project such as this cause environmental changes of tide and land use by closure of sea water and the tideland reclamation work . the present study investigated spectrum characteristics of water are on the sequence of changes using two kinds of satellite images data taken in different times.
3.Satellite Image Data
The satellite image data used in this study is a data set of Landsat TM that has been utilized on the inflow pattern, and the analysis of mixing process in the mouth of a river. It is a satellite image data observed on sep.22, 1992 and on Sep. 28, 1994, the time before and after the completion of the enclosure dike in the Yongam lake and Kum lake. Table 2.2 shows the satellite image data. Geometric correction by ground control points used a topographic map of 1:50,000 scale published in September 1995 in Korea.
| Mission | Landsat TM | Landsat TM |
| Obs. date | Sep. 22, 1992 | Sep. 28,1994 |
| Path-Row | 116-36 | 116-36 |
| Form. type | BIL | BSQ |
| Cloud quan. | 0% | 0% |
4.Methodology
The values of CCT count were investigated for each band of Landsat TM data in the firest place to examine the characteristics of band data using two kinds of satellite images data taken in different times. Composite color images were generated using band 3 ( red ), band 2( green ) and band 1( blur ) respectively . these bands are available to interpret outflow pattern and the phenomenon of water area for band 1, to examine spectral characteristics for band 2 and to an analysis f water turbidity for band3 . these images explain the state of freshening process n the freshening reservoir constructed through tided reclamation project.
The IBASYS software, a kind of image processing system operating on the workstation of Remote sensing/GIS laboratory at Ibaraki University was used to perform geometric correction and unsupervised classification . the areas which include Yongsan river 2nd and 3rd stage district were cut out on 1024 lines by 1024 pixels form each full scene of the original Landsat TM data. The CCT count is examined respectively on the study area of 768 lines by 768 pixels after geometric correction using these images. Eight ground control points were selected form the topographic map of 1:50,000 scale ( fig .4.1) the absolute difference between calculated and measured values of the image coordinates was kept down within 1 pixel. Affined transformation was used for images coordinated corresponding to topographic coordinates.
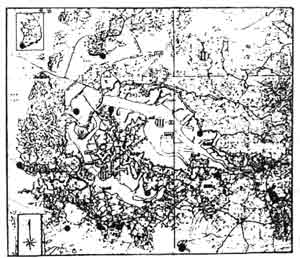
Fig. 4.1 Location of selected of GCPs
The spectrum characteristics of the image data was examined through the CCT count of each category for land cover and each band. The CCT count of each Band was investigated at 3 places in sea, and 6 places in freshening reservoir along the center line of the sea and freshening reservoir, as shown in fig. 4.2. the standard point is the center of the enclosure dike in the freshening reservoir. The values of CCT count for land cover classified into six categories were used the mean values acquired at 3~6 places for each category.
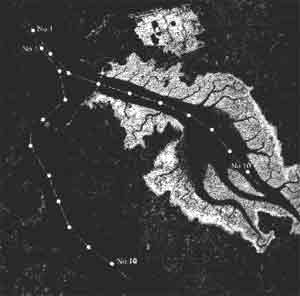
Fig. 4.2 Composite color image of study area [Sep.22,1992] and survey points of the CCT count
5. Resutl and Discussion
The present study investigated spectrum characteristics for each band data on Yongsan river 3rd stages with two satellite images data acquired on different days and field survey, and at the same time, examined the state of the progress of the construction works.
Fig 4.2 shows the situation the enclosure dike completed in Yongam lake and under construction in kum lake. But, in Fig. 4.3, the enclosure dike of Kum lake is also completed and the drained tidal flats are whitened by salt educing on the ground.
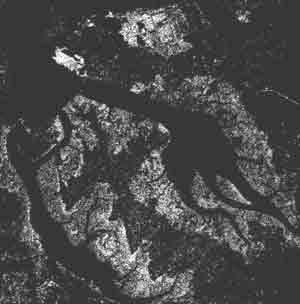
Fig. 4.3 Composite color image of study area [Sep.28,1994]
The freshening process of water area shows the other state, as shown in fig.4.2 that is, Yongsan estuary lake is in completed situation. Yongam lake is under progress, and Kum lake is formatting the same pattern as sea. However, fig4.3 shows the state completed for Yongsan estuary lake and Yongam lake, and under progress for kum lake.
Fig.5.1 shows the value of CCT count for land cover in Yongam lake in Yongsan river 3rd stages. While the variance of sea water and fresh water is hardly shown in the image data of 1992, the images data of 1994 shows a few variance for band1,2 and 3.
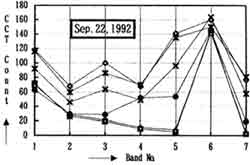
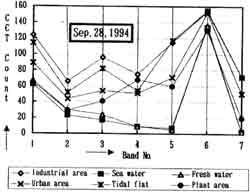
Fig. 5.1 CCT count for land use of Yongsan river 3rd stages
Fig,5.2 CCT count of Yongam lake districtshows the value of CCT count examined for sea water and fresh water along the center line of yongam lake. The images data of 1992 does not show the variance of sea water an fresh water but the 1994 data shows the variance for band1,2 and 3, for the upstream of freshening reservoir. These data show those are few the difference of shades between fresh water from the enclosure dike to the center of Yongam lake and sea water.
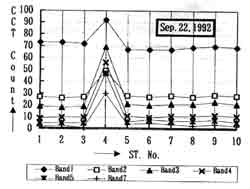
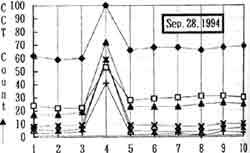
Fig. 5.2 CCT count of Yongam lake district
Fig.5.3 is the value of CCT count in Kim lake, under condition mentioned above. It shows the same pattern as in Fig.4.2. the value of CCT count for sea water and fresh water is the same because the enclosure of Kum lake is incomplete. The values of band1, 2 and 3 also shows the variance.
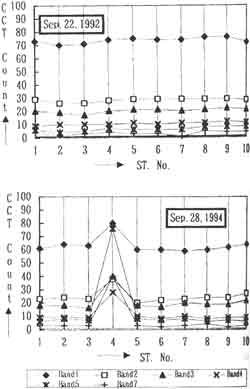
Fig. 5.3 CCT count of Yongam lake district
Fig .5.4,5 are the images classified by the ward method of the unsupervised classification methods of the land cover classification. In the these images, while a body of water in the freshening reservoir is not shown, the situation of freshening process is classified clearly.
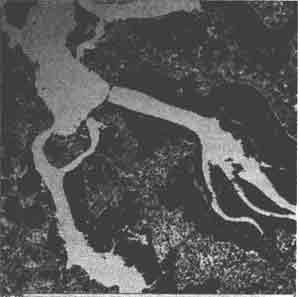
Fig. 5.4 Unsupervised classification image [Sep.22, 1992]
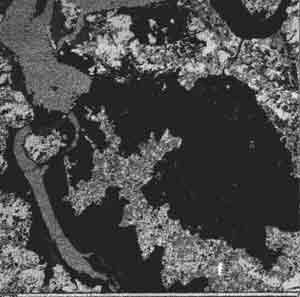
Fig. 5.5 Unsupervised classification image [Sep.28, 1994]
6. Conclusions
The study examined spectrum characteristics for each band land cover on comprehensive agricultural development project for Yongsan river watershed 3rd stages progressing in Korea now. And, the classification images based on the values of CCT cont were generated. As a result an analysis of water area including sea water and fresh water can investigated by using Landsat TM data. Of the data, especially band 1,2 and 3 are applicable to the analysis of the shades and water quality in the freshening reservoir. And, it was also shown fundamental knowledge to extract more detailed information.
References
- Choi,M.S.,T. Hoshi: Analysis of water area pattern on Youngasangang 3rd stages, Proc of Annual Conference of JSPRS, 1-4,pp203~206, 1997.
- Torii K., T. Hoshi, B.J.Cho, D.W.Kang: Application of satellite Images Data to Tideland Reclamation Project in Southwestern Coastal Zone of Korea, Proc. Of the 14th ACRS,B-4-1 ~6.1993.
- Torii K., T. Hoshi et. Al.: Investigation on Tidal Land Reclamation in Korea Using Satellite image Data, proc.of the 17th ACRS, G-4-1~6. 1996.
- Kazuhiro SATO, Dwi Setyono, saw Eh DAH structure of satellite data for mangrove Area in Okinawa (1) - Structure of TM data of Landsat 5 for Mangrove Area in Iriomote Island Proc. Of the 14th ACRS, E-3-1~6,1993.