| GISdevelopment.net ---> AARS ---> ACRS 1997 ---> Poster Session 1 |
Comparison of Urbanization
and Environmental Condition in Asian Cities using Satellite Remote Sensing
Data
Makoto Kawamura, Sanath
Jayamana, and Yuji Tsujiko
Dept. of Architecture and Civil Engineering
Toyohashi University of Technology
1-1 Hibarigaoka, Tempaku Cho, Toyohashi Shi, Aichi 441, Japan
Tel: (81)-532-47-0111 Fax(81)-532-44-6831
E-mail :r937654@res.tutcc.tut.ac.jp
Abstract Dept. of Architecture and Civil Engineering
Toyohashi University of Technology
1-1 Hibarigaoka, Tempaku Cho, Toyohashi Shi, Aichi 441, Japan
Tel: (81)-532-47-0111 Fax(81)-532-44-6831
E-mail :r937654@res.tutcc.tut.ac.jp
In this study urbanization and the environmental condition of several Asian cities have been compared using satellite remote sensing data. First the applicability of the proposed index UI and NDVI in different season and different region is examined. Then the UI-NDVI relation for 500 m grid is used to compare the urbanization condition within the cities and the UI-NDVI relation for the larger administrative units is used to compare the urbanization conditions of the cities at a regional level.
1. Introduction
Many urban areas in Asian countries fast due to rapid economic growth in these nations. This has given rise to many environmental problems that demand urgent attention. The increasing spatial concentration of people and productive activities also have environmental spillover effects outside the urban area itself, many leading to problem of a global nature. Therefore it has become necessary to develop a method to quantitatively evaluator urbanization and its relation with the natural environment condition quantitatively. The high cost and time required for traditional data collection methods have made as systematically developed urban database beyond the reach of many planning authorities in these countries. However satellite data can be applied to evaluate the changing conditions of the rapidly growing urban areas due to reported global coverage.
The objective of this study is to develop the method for the spatial evaluation of urbanization and its relation with the natural environment quantitatively using satellite remote sensing data so the urbanization and the balance between urban development and the environmental condition in the different urban areas cab be compared . this analysis will provide a basis for the discussion of sustainable development of cities. The urbanization index UI, proposed by the authors and estimated using Landsat TM data was used in this study to quantitatively evaluate urbanization. The Normalized Difference Vegetation Index 9NDVI) was used ot quantitatively evaluate the vegetation condition which represents the natural environment in ht urban area. The spatial characteristics of the indices UI and NDVI wer examined in this study by using data of this analysis it was seen that by using the UI-NDVI relation for the different cities the numbers of urbanized units and its balance with the vegetation area can be compared. The comparison was made for two classes of spatial units. One of for a 500m by 500m grid to compare the urbanization conditions at a regional level.
In this study satellite remote sensing data and conventional data of several Asian cities has been used. They are Colombo city in Sri Lanka ,Lumpur city in Malaysia, Morkpo and Ulsan Cities in South Korea , Nagoya city in Japan and several other cities in Aichi prefecture in Japan. These cities in Aichi prefecture in Japan. These cities in Aichi include Komaki, kasugai , Owariashai , Nagakute, Toyoake , Kariya , Tokai ,Obu, Seto and Obara cities. The area within the municipal council limits of Colombo city is 3370 hectares with a population of 650000. the federal Territory of Kuala Lumpur is approximately 24000 hectares with an estimated population of 1.4 million. Morpo city in South Korea has a land are of 2580 hectares with a population of 245000 and Ulasn city is 18190 hectares with a population of 708000. Nagoya city has a land area of 33000 hectares and consists of a population of 2.2 million. It is the largest city in the Aichi Prefecture.
Landsat TM data used of Colombo is of December 1987 and February 1993. a 1:50,000 land use map of 1981 of the Colombo District, and urban vegetation map of 1981 of the Colombo Urban Area and a 1:12672 building cover map of 1970 of the Colombo City was used. Statistical data used relate to the period 1991 to 1993.
Landsat TM data of Kuala Lumpur is of June 1989. a 1:50000 land use map of 1984 of Kuala Lumpur and Petaling Jaya, a 1:10000 land use and building cover map of 1988 of Kulala Lumpur and statistical data of 1983 was used.
Tm data used of Mokpo city in South Korea is of September 1992 and the Landsat TM data used in the case of ulsan city in South Korea is of January 1992.
TM data used of cities in Aichi prefecture in Japan is of July 1985 and July 1995 ( summer season ) and November 1985 and November 1991 ( winter season ). Land cover data of Nagoya city is of 1987, 1:10000 building cover maps of Nagoya and Toyohshi cities and statistical data relating to cities in Aichi Prefecture has been used.
2 The Urban Index Ui and its Effectiveness to Estimate Urbanization in Different Urnban Areas.
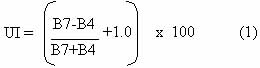
The Urban index shown by Eq. 1 below is computed by using Landsat TM bands 7 and 4 and has been proposed by the authors ( Kawamura et al, 1996) to estimate urbanization.
2.1 The Relation of UI with Urban Density (UD) for a 500m grid in different cities
The relation of UI with urban density (UD) measured by the building cover density has been investigated by the authors in a previous study for Colombo city in Sri Lanka ( Kawamura et al, 1996). The UD value or a 500m by 500m grid unit is the percentage of the area covered by buildings with in this unit. In this study the UI-DI relation was examined for a 500m grid for Nagoya City and Toyohashi city in Japan using TM data of both winter and summer seasons and also for Kuala Lumpur city in Malaysia. Building cover information of Nagoya and Toyohashi cities and Kuala Lumpur city has been obtained by scanning 1:10000 building cover maps. The TM data used for Nagoya and Toyohashi cities is of November 1991- winter season, and July 1995-smer season and for Kuala Lumpur city is of June 1989. the satellite data used in the space of Colombo city is of December 1987. UD and corresponding UI values were computed for the 500m gird units. Water areas have been omitted form the computation . the UI-UD relation for the four cities and different seasons is shown in Fig. 1. these figure showman approximate uniform relation for the different cities . this implies that UI can be used to compare the level of urbanization in the different urban areas .
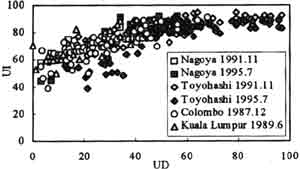
Fig. 1 UI-UD Relation for cities
2.2 Relation of average UI value for each city with physical and social parameters of urban development
The relation between the average UI value for each city and the percentage of ht densely developed are comprising of commercial, industrial and residential area in each city is shown in fig.2.
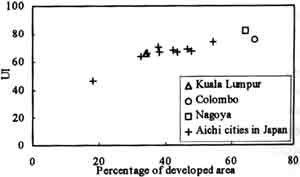
Fig. 2 Relation between UI and the percentage built-up area.
In fig .3 the relation between the average UI value for each city and the population density in each city is shown. Form these figures it can be seen that the average UI value for each city represent its level of urbanization.
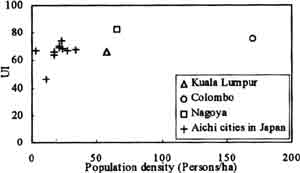
Fig. 3 Relation between UI and population Density
3. The Normalized Diference Vegetation Index (Ndvi) and it Apliccaiton to Estimate the Environmental Condition in Urban Areas.
The Normalized difference Vegetation Index (NDVI0 is a quantitative measure based upon digital values the at attempts to measure biomass or vegetative vigour. High NDVI values identify pixels covered by substantial portions of healthy vegetation . in recent times the importance of urban vegetation in preventing the deterioration of the urban environment has been well recognized. Therefore NDVI can be used as a measure of ht environmental in the urban area.
In this study NDVI is computed as shown by Eq. (2) using Landsat TM bands 3 and 4.
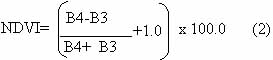
Fig.4 show how NDVI is related to the vegetation density in the Colombo Urban Area . the percentage vegetation in the planning units within the city of Colombo and the larger urban council units outside the city has been calculated by overlaying an urban vegetation map of the urban area with a map showing the boundaries of the spatial units. This figure shows that NDVI is strongly related to the vegetation density in the urban area and therefore is a measure of its environmental condition.
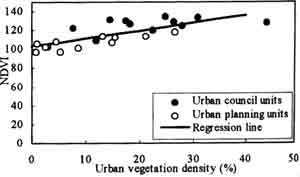
Fig. 4 Relation between NDVI and urban vegetation density
4. Influence of Season on ohe Indices UI and NDVI
Using Landsat TM data for Nagoya city of July 1985 (summer ) and November 1985 ( winter ) the change in UI and NDVI was computed for approximately 500m grid units for different types of land cover. Land cover information was obtained form TDT data of 1987. the grid units were assigned to a class of land cover if more than 60% of the TM piles within with the grid belonged to that class. The computed change in UI and NDVI due to seasonal change for these grids belonging to the different classes of land cover be seen in Fig. 5. this figure shows that except for paddy lands which changes form a vegetation area in summer to a bare land in winter the change in UI is relatively smaller than the change in NDVI due to seasonal change. This can be explained by liking at Fig. 6. which show the seasonal influence on bands 3,4 and 7 for commercial and industrial areas. This figure shows that the change in band3 is relatively larger than the change in band7.
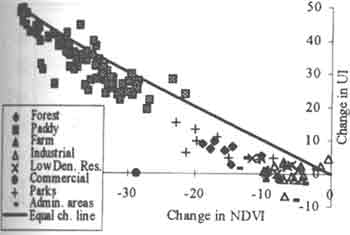
Fig. 5 Seasonal change in index value
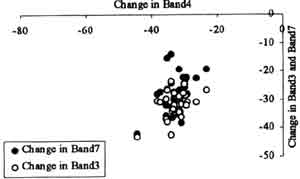
Fig. 6 Changes in Band 3, 7 and 4 in commercial and industrial areas
5. Influence of Region on the Indices UI and NDVI
The UI-NDVI relation for three cities computed by using a 500 by 400 TM pixel images is shown in fig. 7.8 and 9. the average UI and NDVI values have been competed for approximately 500cm grid units or 17 by 17 TM pixels . in the case of Colombo and Kuala Lumpur cities the TM images have been registered w3ith scanned 1:50000 land cover maps of the urban areas. In the case of Nagoya city land cover information has been obtained form TDT data. Each approximately 500m grid unit was considered to belong to category if more than 60% of the TM pixels within the grid unit belonged to that category.
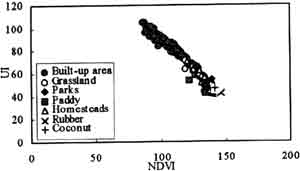
Fig. 7 UI-NDVI Relation with land cover for colombo City
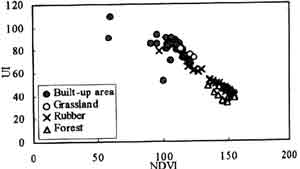
Fig. 8 UI-NDVI Relation with land cover for Kuala Lumpur City
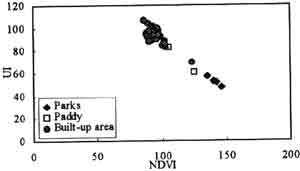
Fig. 9 UI-NDVI Relation with land cover for Nagoya City
Form the land cover categories in these three urban areas categories common to at least two cities were selected. They are Built-up area, grassland, parks and rubber. All the pixels belonging to these categories were picked up and their UI and NDVI values are shown in Fig. 10. form this figure it can be seen that the indices UI and NDVI have ea similar range of values for the same class of land core even in very different regions. Therefore the UI-NDVI relation can be applied in different cities to compare the environmental condition in different urban areas provided that seasonal conditions are similar.
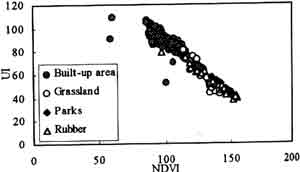
Fig. 10 UI-NDVI Relation of cities for common categories of land cover
6. Comparison of Cities using the UI-NDVI Relation
6.1 Comparison of cities using the UI-NDVI relation based on 500m grid.
The UI-NDVI relation for Colombo, Kuala Lumpur and Nagoya cities are shown in Fig.11(a) to (c). the TM images used are of the summer season. The area within the administrative boundaries of the cities was considered. Each point shown in the figure represent approximately 500m grid units. A land cover classification was done using a neural network program to separate the TM pixels belonging to urban areas and vegetation areas. The 500m girds were assigned as belonging to urban or vegetation classes based on this land cover classification. If more than 70% of the 17 by 17 TM pixels within the approximately 500m grid belong to a class, then the grid unit was classified ad belonging to that class. In the fig.11(a) to (c) the most of urban areas are located in the zone where UI is greater than 60 and NDVI is less than 120. on the other hand the vegetation area is in the zone where UI is less than 60 and NDVI is greater than 120. the UI-NDVI relation represents the intensity of urbanization in the city, that is, the number of urbanized units. The relation for Colombo city can be seen in Fig. 11(a). the absence of vegetation area pixels indicated that there are no larger areas of vegetation within the city limits. As shown in Fig. 11(b) Kuala Lumpur has large areas of both urban and vegetation classes within the city. The UI-NDVI relation for Nagoya city in Fig.11(c) shows that Nagoya city has large urban areas and a few vegetation areas. From these figures it can be seen that the relation between UI and NDVI cab be used to recognize and compare the urbanization condition of the different urban areas.
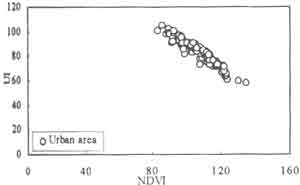
Fig. 11(a) UI-NDVI relation for Colombo City
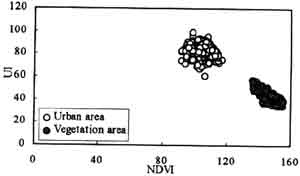
Fig. 11(b) UI-NDVI relation for Kuala Lumpur
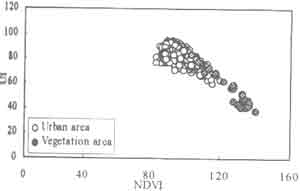
Fig. 11(c) UI-NDVI relation for Nagoya City
6.2 Comparison of cities using the average UI and DNVI values of cities
The average UI and NDVI values for the different cities are used to show the UI-NDVI relation for cities in Fig. 12. the city area considered in calculation comprises of the area enclosed within the administrative boundaries .Fig .12 . shows that the state of urbanization of the different cities can be recognized at a regional level using this UI-NDVI relation.
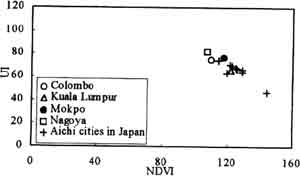
Fig. 12 UI-NDVI relation for Cities
7. Conclusion
In this study spatial characteristics of the proposed index UI and NDVI were examined UI was used to estimate urbanization and NDVI was used to estimate the environmental condition quantitatively in the different urban areas. Two classes of spatial units were considered in this study . one was the 500m grid units to estimate the urbanization conditions with in the cities and the other was larger administrative units of the cities to estimate urbanization conditions at a regional level. The relation between UI and NDVI for an urban area showed the relationship between urbanization and the environmental condition of an urban area quantitatively. It was shown that this relation for different cities can be use to compare the urbanization condition in the different urban areas quantitatively provided the seasonal conditions were similar. It showed the number of urbanized units and its balance with the vegetation area. It also showed how the urbanized area and the vegetation areas were spatially distributed.
Reference:
- Kawamur , M., Jayamanna .S.,Tsujiko, Y., ' Relation between social and environmental conditions in Colombo Sri Lanka and the Urban Index estimated by satellite remote sensing data', Internatonal archived of photogrammetry and remote sensing, 1996, Vol XXXI, part B7 ( commission VII), pp 321-326.