| GISdevelopment.net ---> AARS ---> ACRS 1997 ---> Poster Session 1 |
Estimation of Percent
Vegetation Cover of Grassland in Monglia using NOAA AVHR Data
Tserenkhuu Purevdorj and
Dryutaro Tateishi
Center for Environmental Remote Sensing, Chiba university, Japan. Phone L 043-290-3850, Fax: 043-290-3857
E-mail :tateishi@rsirc.cr.chiba-u.ac.jp, dorj@rsirc.cr.chiba-u.ac.jp
Abstract Center for Environmental Remote Sensing, Chiba university, Japan. Phone L 043-290-3850, Fax: 043-290-3857
E-mail :tateishi@rsirc.cr.chiba-u.ac.jp, dorj@rsirc.cr.chiba-u.ac.jp
NOAA AVHRR data were used to estimate a percent vegetation cover of grassland in Central southern NOAA AVHRR data were used to estimate a percent vegetation cover of grassland in Central southern Monthodology of the estimate was developed on the basis of spectral reflectance measurements which were conducted on grasslands Mongolia.Vegetation indices such as NDVI, SAVI, MSAVI, and TSAVI, were calculated from spectral by pixel values of red, green and blue band of digitized color photographs. Relationships between various vegetation indices and percent vegetation cover were compared using a vegetation cover for wide range of grass of grass density.
1. Introduction
Grasslands in semi-arid areas of Mongolia extend over large areas and efficient grassland monitoring and management is very important for livestock breeding, agriculture and environmental study. Estimating green vegetation cover amount is one of the key problems in grassland monitoring. On considering economic and scientific aspect of the estimation vegetation cover amount in relatively arid and semi-arid countries such as Mongolia, is quite actual and urgent problem. Particularly, it is very important to develop the efficient vegetation monitoring system using satellite data in the region. Grassland monitoring requires a reliable and repeatable technique of accurate and timely information on vegetation for the spatial and temporal coverage, From this point, AVHRR provides an attractive data source for large survey area and has high probability of obtaining cloud-free data over a growing season for my any given geographical area. Sensed data for vegetation monitoring.
The aims of the research reported in this paper were to estimate green vegetation cove of semi-arid grassland from NOAA AVHRR data.
2. Study Area
Over experiment was conducted on grasslands in Mongolia. Authors selected three representative places, each of them belongs to mountain steppe, plain steppe and semi-desert steppe respectively.
The first group of test sites includes two sites (Site 1 and Site 2 in Table 1) in the southern portion of Mongolia. The sites are located in territory of Dundgoivi aimag, approximately 300 km south of the capital city Ulaan baatar and belong to the semi-desert Central Asian regions.
The second group of test sites (Site 3 and Site 4 in Table 1) belongs to the plain steppe, which is widely spread out in between the small mountains and valleys and this is the main area for the cattle folder and nutrition in the country throughout a year.
The third group of test sites includes two sites (Site 5 and Site 6 in Table 1) belonging to the mountain steppe widely spread out in central, north and western regions of Mongolia and have usually dark brown and brown soil.
| Site number | Date | Location (degree, minute) |
| 1 | 1996.08.08 | 45,37.325 N 106,14.019E |
| 2 | 1996.08.10 | 46,22.011 N 105,46.907 E |
| 3 | 1996.08.14 | 47,22.718 N 106,20.875 E |
| 4 | 1096.08.20 | 47,41.923 N 108,03.770 E |
| 5 | 1996.09.01 | 48,20.206 N 104,06.429 E |
| 6 | 1996.08.27 | 48,09.075 N 104,45.486 E |
3. Methods
The research methodology was developed in several stages: field measurements of vegetation cover reflectances, model formulation, ground measurements of green vegetation cover, satellite data processing and validation of the estimate of green vegetation cover. The field measurements of vegetation cover reflectance and model formulation were reported in our previous works (Ts. Purevdorj et al., 1996, Ts. Purevdorj et al., 1997)
3.1 Function for the estimate of percent vegetation cover by VI
The semi-empirical model was used in the study for the estimate of green vegetation cover from NOAA AVHRR data in the semi-arid region. Estimating model was formalized by applying a regression technique to the data where the percent vegetation cover was held as the dependent variable, while the VIs values was held as the explaining variable (Ts Purevdorj et al., 1997). The equations which describe empirical relationships between percentage green vegetation cover and VIs are:
Cover (%) = 1.062 + 43.5442* TSAVI + 97.817*TSAVI2 (2)
Our experimental results (Purevdorj et al., 1996) indicated that NDVI and TSAVI perform better result than VIs for the estimate of green vegetation cover. Therefore, in the study these two polynomial equations of second order were chosen as a equation for estimating percent green vegetation cover from the NOAA AVHRR data.
3.2 Field measurement of vegetation cover
Ground measurements of vegetation cover amount for the test sites were carried out during August and September 1996. Sampling sites were chosen in the large homogeneous areas of grasslands so as to be best represent the grasslands and concentrated in the low and middle vegetation densities region which are most difficult and important to detect by AVHRR data. The geographical location was determined by GPS camera "Konica". A total of 6 sites were sampled during the ground truth campaign(Table 1) with one sample plot in each test site.
Sampling scheme was similar for all test sites and carried out as following. In each of the test sites random about 1km x 1km area was chosen. For the site wee sampled 25 points and the color photographs of ground cover of the points we taken. Then vegetation cover of each point was estimated by counting numbers of green vegetation pixels using pixel value of red, green, and blue band of the digitized photographs. The total vegetation cover amount for each test site was determined as mean of the percents vegetation cover estimated for 25 sample points. The estimates of green vegetation cover for the sampling sites are presented in Table 2. Calculated values of standard deviation given in Table 2 show that vegetation density is relatively constant.
| Site 1 | Site2 | Site3 | Site4 | Site5 | Site6 | |
| Mean | 13.4 | 14.0 | 25.0 | 44.2 | 8.8 | 15.0 |
| Standard deviation | 2.6 | 4.0 | 5.8 | 5.9 | 2.4 | 4.2 |
5. Image processing
In order to compare the ground measurements of percent vegetation cover with the estimate from satellite data, were used NOAA AVHRR High Resolution Picture Transmission (HRPT) data. The images acquired during the field measurement wee processed and visually examined on the basis of false color composites to ensure that only cloud-free data were used for the estimate. From the images, two scenes were selected. These two scenes acquired on August 3, 1996 in receiving station of Ministry of Nature and Environment of Mongolia and on August 12, 1996, from the archives of the EROS DATA CENTER (USA) were as least cloudy image for test sites. Subscenes of 1200 X 1200 pixels for the study images are located between 40 to 50 degree latitude and 100 to 110 degree east longitude.
4.1 Geometric correction
The images were geometrically corrected by "PaNDA" using ground control points. The ground control points wee obtained from Operational Navigation Chart (1: 1 000 000, Defense Mapping Agency Aerospace Center, St. Louis, Missouri, 1988).
4.2 Atmospheric correction
In the study atmospheric correction of the AVHRR Channel 1 and Channel 2 was carried out using "6S" program (Goddard Space Flight Center, USA ) which was adopted by authors in SUN SPARC workstation. After atmospheric correction of the Channel data the NDVI values were calculated and made the histogram. The comparison of the histogram indicates that there is intrinsic differences between the arospherically corrected and uncorrected NDVI values (Figure 1). The results show that maximum value of the uncorrected and corrected NDVI was about 0.62 and 0.79 respectively.
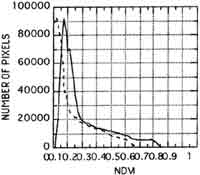
Figure 1: Histogram of atmospherically corrected of NOAA AVHRRR.
5. Satellite data analysis
After radiometric, geometric, and atmospheric correction of Channel 1 and Channel 2 data, VIs values were calculated regarding to formulas described in the section 3.2 The calculated VIs data sets were formed into maximum value composite images. The derived relationships between percent vegetation cover and VIs values (regression equations (1) and (2) described in the section 3.2), wee applied to the corrected AVHRR Channel data to produce images of the vegetation cover estimates for test sites. Form the estimated vegetation cover image were extracted 5 x 5 pixels boxes, centered on the geographic coordinates of each ground data collection site. The mean and standard deviation of the percent each ground data collection site. The mean and standard deviation of the percent each ground data collection site. The mean and standard deviation of the percent vegetation cover estimated by NDVI and TSAVI for these 25 pixels wee calculated for each site. Histograms of the estimated green vegetation cover are shown in Figure 2.The accuracy of the estimate were calculated as absolute differences between the ground measurement and the estimated values from satellite data (Table 3 and Figure 3). Form the results, it can be concluded that percent vegetation cover estimated from the AVHRR data were lower than the estimate from the ground measurement.
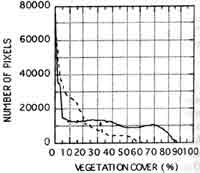
Figure 2: Histogram of green cover estimates by NDVI and TSAVI.
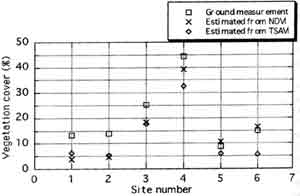
Figure 3. Ground and satellite estimate of green vegetation cover.
| Sites | Ground Truth | Estimated by NDVI | Estimated by TSAVI | Absolute error (NDVI) | Absolute error (TSAVI) |
| Site 1 | 13.4 | 3.8 | 6.36 | 9.62 | 7.06 |
| Site 2 | 14.0 | 4.88 | 5.48 | 9.14 | 8.54 |
| Site 3 | 25.3 | 18.48 | 17.88 | 6.85 | 7.45 |
| Site 4 | 44.2 | 39.32 | 32.72 | 4.88 | 11.48 |
| Site 5 | 8.8 | 1.84 | 6.12 | 2.04 | 2.68 |
| Site 6 | 14.96 | 16.32 | 5.64 | 1.36 | 9.32 |
| Mean absol. error | 5.65 | 7.75 |
6. Conclusion
Green vegetation cover was estimated from NOAA AVHRR with a satisfactory accuracy and the similarity between the estimated green cover from satellite and ground data is remarkable. Standard deviation of the estimate ground and satellite data wee comparable.
The soil background effect were corrected by TSAVI which uses coefficients from the soil line developed for the test sites. Also the atmospheric effects were corrected by "6S" program and the correction results that maximum differences between corrected and uncorrected NDVI was bout 0.18 in high vegetated area. Therefore, accurate atmospheric correction is one of the most important factors to improve an accuracy of the estimate of the vegetation characteristics.
TSVI has better accuracy in the estimate of green vegetation cover less than about 20 percent green coverage and accuracy of by the estimate by NDVI has been became higher than the estimate by TSAVI with increasing green vegetation cover . in addition , mean error of the estimate show that NDVI gives best estimate of the percent green vegetation cover for wide range of grass densities. Also it was observed that vegetation cover value estimate by TSAVI were lower than the estimate by NDVI when NDVI has better accuracy , an that vegetation cover value estimated by NDVI were lower than the estimate by TSAVI when TSAVI has better accuracy. Consequently, maximum values of these two estimates were always close to go9rund measurements of green vegetation cover.
The analysis showed that percent vegetation cover estimated from satellite data were lower than the estimate form the ground measurements for the test sites. In summary, the results shows that green vegetating cover amount can be estimated from AVHRR data with certain accuracy by NDVI and TSAVI using a polynomial equation of second degree.
From this study, it is concluded that, on the basis of the results, the method in this study to estimate vegetation cover has been shown to be useful in estimating green cover in grasslands and can be applied to NOAA AVHRR data for the estimate of green vegetation cover of grassland in arid and semi-arid regions.
Reference:
- Baret, F., and Guyot , G., 1991, potentials and limits of vegetation indicas for LAI and APAR assessment. Remote sensing of environment, 35, 161-173.
- Elvidge, C.D., and Ronald, J.P.Lyon., 1985, influence of Rock-soil spectral variation on the assessment of green biomass. Remote sensing of environment, 17, 265-279.
- Hute , A.R.jackson , R.D., and Post D.F., 1985, Spectral response of a plant canopy with different soil background. Remote sensing of environment, 17,37-53.
- Purevdorj, Ts., Ishiyama, T., Tateishi, R., and Furuya ,T., 1996 , Estimating of percent vegetation cover using vegetation indices. Proceedings of the symposium of the Japan Society of Photogrammetry and Remote Sensing, Yamagata , Japan, 8-9 October 1996, pp. 101-104.
- Teserenkhuu Purevdorj, Ryutaro Tateishi and Takaishi Ishiyama, 1997, Estimating of percent vegetations cover using vegetation indices ( second report ) . proceeding of the symposium of the Japan Society of Photogrammetry and Remote sensing. Chiba University Japan, 20-21 May, 1997 , pp. 291-296.
- Wiegand, C.L., Richardson ,A.J., Escobar, D.E., and Gerbaermann ,A.H., 1991, Vegetation indices in corp. assessments. Remote sensing of environment, 35, 105-119