| GISdevelopment.net ---> AARS ---> ACRS 1997 ---> Poster Session 1 |
The study of Bi-directional
Reflectance Distribution Function ( BRDF) for the Grassland
Chihiro Watanabe, Yoshiaki
Honda, Koji kajiwara
Center for Environmental Remote sensing ( CEReS), Chiba University
1-33, Yayoi, Image-Ku Chiba 263, Japan
Tel(81)-43-290-3945 FAX:-43-290-3857
Abstract Center for Environmental Remote sensing ( CEReS), Chiba University
1-33, Yayoi, Image-Ku Chiba 263, Japan
Tel(81)-43-290-3945 FAX:-43-290-3857
As we estimate a physical quaintly of vegetation using remote sensing data, we can not ignore the effect by the sun-target-sensor geometry. Therefore, we require a method of estimation between a reflectance and a physical quantity of vegetation .for understanding bi-directional reflectance profiles, we did the ground truth for grassland in Mongolia on August 1996. and we develop a simple model based on a general layer model ( for-flux theory ) and apply the measured data to it is clear that the model is useful.
1. Introduction
When an analysis of physical quantity of vegetation using a satellite remote-sensing technology, it is very effective for monitoring of a global area. But these satellite data include many errors by an atmosphere, sun-target-sensor geometry, sensor characteristics and so on . we should understand effects by them and correct. Especially, the effect by sun-target senor geometry as measurement using a middle or a low resolution sensor is greater than others. Therefore, we carried out the ground truth for the Mongolia, grassland, and analyzed bi-directional reflectance profiles . and we develop a BRDF model and apply the measured data to it.
2. Objective
The main purpose of this are as follows.
- development of the measurement system for the directional reflectance and the ground truth.
- Development of the BRDF model for an estimation f reflectance or a radiometric correction .
A measurement system for the directional reflectance is not general. Then we develop the measurement system. Requirements of this system is as the follows.
- The change of the solar zenith angle and the solar azimuth angle is minimum while measure.
- It is easy to setup the system.
- It can obtain the spectral reflectance and the target image at the same time.
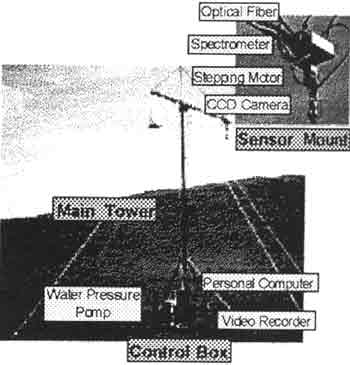
Figure 1: Measurement System
This system consists of there parts, the main tower, the control box and the sensor mount. The height of main tower can be changed form 1.5 m to 5 m by water pressure pump. The control box collect data and control the sensor position with a personal computer. The sensor mount consists of the stepping motor for change a sensor position, the spectrometer and the CCD camera for take target images. This spectrometer have dual ports, the sample port and the reference port, so the measurement time is shortened because the measurement of reflectance is at the same time. Detail function are shown the table . 1.
| Wavelength | 350-1050nm |
| Spectral resolution | 0.342 nm/ch (2048ch) |
| Integration time | 0.008-2.04 sec |
| Gain | 1-8 |
| Accumulation count | 1.255 |
| FOV Angle | 20 deg |
| Quantizaiton Level | 16. bit |
| Sensor Height | 1.5-5 m |
| Sensor azimuth Angle | 0-360 deg |
| Sensor Zenith Angle | 0-70 deg. |
4. Observation
We carried out a observation using above system for the 6th to the 20th of August 1996 in Mongolia . measurement areas are the three points with different vegetation conditions ( see the figure .2) targets vegetation is a flat and homogenous grass, ex. The grass height is about 15 cm on average and vegetation coverage is about 20% at the area (3). The measurement conditions show the Table .2. One cycle of measurement is every 30 degree for 0 degree to 330 degrees for the sensor azimuth of sensor zenith angle. Time of one cycle require about 25 minutes .
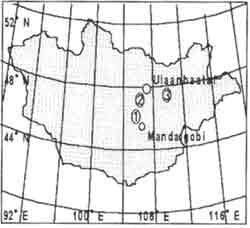
Figure 2: Observation Areas
| Location | N47°41, E108°03 (3) |
| Date | 1997/08/20 |
| Time | 9:00-16:00 |
| Solar zenith angle | 35-70 deg |
| Solar Azimuth Angle | 94-250 deg |
| Vegetation Coverage | About 20% |
| Vegetation height | 3-20 cm |
| Sensor Height | 5 m |
| Sensor Azimuth Angle | 0-330 deg ( every 30 deg ) |
| Sensor zenith Angle | 0-60 deg ( every 10 deg ) |
5. Model Simulation
our developed model is a simple layer model based on flour-flux theory like the suits model(1) and the SAIL model(2). The four-flux theory is written by :
| Speclar Flux : | dEs ----------- dx |
= kEs |
| unward Diffuse Flux : | dE- ----------- dx |
=sEs + aE--sE+ |
| Downword Diffuse Flux : | dE+ ----------- dx |
= s'Es +sE--aE+ |
| Radiation Flux : | dE0 ---------- dx |
= wEs+vE-+uE+-KE0 |
each coefficient in the different equations are calculated form vegetation parameters. This model purpose is for estimation and correction of radiance energy from the target, therefore we should not use that a measurement is difficult parameter such as the leaf area index ( LAI) or the leaf inclination density functions ( LIDF), then we used the vegetation height and the vegetation coverage calculated from the target image.
we need scattering parameters in the vegetation layer for lead coefficients. Then we define a model consisting of simple geometric figures using the vegetation height and the vegetation coverage. Coefficient is calculated by using the scattering characteristic of figures instead of the vegetation scattering characteristic in the layer.
6. Results
we could obtain many spectral data and image data at same in the short time ( about 25 minutes per one cycle).
Results are shown the figure. 4-7. the figure 4 and 5 are the spectral reflectance characteristics as change the solar zenith angle. As you can see, the senor zenith angle is the greater and greater, spectral reflectance is the higher and higher all over the wavelength. The figure 6 and 7 depict the 3-D plotting of directional reflectance profiles as change the senor angle in the red region ( 580m,-680nm0 and in the near infrared region ( 725nm-800nm) respectively. These figure represent that deference between the red and infra-red region depends on sun-target-senor geometry.
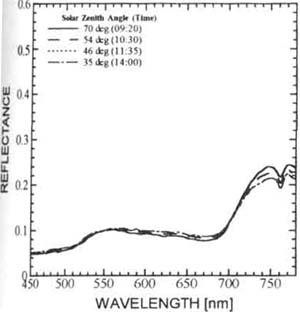
Figure 4: The Spectoral Reflectance Characteristic (the Sensor Zenith Angle is 0 deg)
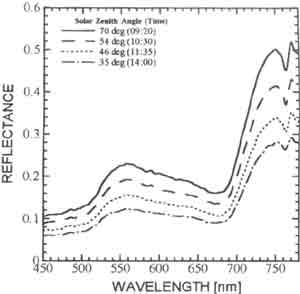
Figure 5: The Spectoral Reflectance Characteristic (the Sensor Zenith Angle is 60 deg)
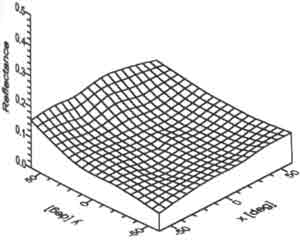
Figure 6: The Directional Reflectance Profile in the RED (580-680nm)
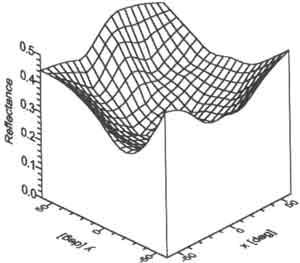
Figure 7: The Directional Reflectance Profile in the N-IR (680-725nm)
Using this model, results of simulation applied to measured data are shown figure 8 and 9. in the red region, results are correspondence of simulation and measurement., but are to correspondence in the near infrared region . Especially , in the forward scan area, the measurement data is higher, but the simulation data is lower, the. We think a reason that the calculation by he model use only surface reflect with geometric figures.
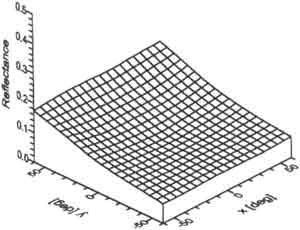
Figure 8: The Directional Reflectance Profile in the RED by the Model Simulation
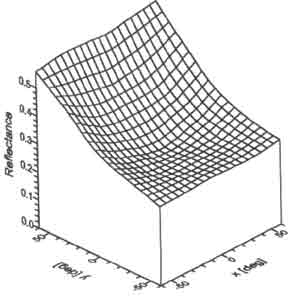
Figure 9: The Directional Reflectance Profile in the NIR by the Model Simulation
In figure 6-9, ( 0,0,0) is the semor nadir, (0, -¥ , 0) is the solar direction , ( x2+y2)1/2 is the senor zenith angle and arctan ( -x/y) is the sensor azimuth angle.
7. Conclusion
the measurement system was able to the whole measurement ( control the sensor and collect data ) automatically .
it was cleared that directional reflectance profiles obtained by this system for the sparse vegetation such as the Mongolian grassland.
We could confirmed that the estimation of reflectance by the model proposed in this study is very useful method. Moreover this model be improved for the algorithm and the accuracy.
Bibliography
- Gwynn H. Suits , The calculation of the Directional Reflectance of a vegetation canopy, Remote sensing of environment 2:177-125( 1972).
- W. Verhoef, Light scattering by Leaf Layers with Application to canopy Reflectance Modeling SAIL Model , Remote Sensing of Environment 16:125-141 ( 1984).