| GISdevelopment.net ---> AARS ---> ACRS 1997 ---> Poster Session 1 |
Identification of Non-Point
Source Pollution Risk Using GIS and Remote sensing Techniques
N.D.K.Dayawansa
Department of Agricultural Engineering, university of Peradeniya, Sri Lanka
J.P.Delsol, H.Andrianasolo and V.V.N.Murthy
STAR Program, AIT,P.O. Box 4, Klong Luang, Pathumthani 12120, Thailand
Abstract Department of Agricultural Engineering, university of Peradeniya, Sri Lanka
J.P.Delsol, H.Andrianasolo and V.V.N.Murthy
STAR Program, AIT,P.O. Box 4, Klong Luang, Pathumthani 12120, Thailand
Non-point source pollution is a major problem in most of the agricultural catchments where sediments, plant nutrients, pesticides and animal constitute the pollutant loads. In this study, Agricultural Non-point Sources (AGNPS) pollution model was used to simulate runoff. Sediments and nutrient transport from a sub catchments. The land use data was derived form the supervised classification of IRS LISS II imagery and the modeling resolution for input data was set ot 40 acres. Results were obtained for the individual rainfall events and also for the total rainfall days in the rainfall year 1992/93. the reduction of pollutant loads due to the application of sloping Agricultural Land Technology 9 SALT) is also verified through model simulations.
Introduction
With population growth, the demand for land and water resources hs been ever increasing all over the world. The over exploitation of these resources leads to a number of environmental problems including pollution of streams and water bodies. Non- point source agricultural pollution is one of the major factor in polluting surface waters in agricultural areas. Non-print sources are those which discharger into a catchment in a way that they depend upon the routes of the hydrological cycle to transport them to the stream system. They differ from te point sources due to their unidentifiable nature and the difficulty in control and management . the non-point agricultural pollutants are organic and inorganic materials including sediments, plant nutrients, pesticides and animal wastes entering surface and ground waters form non-specific or undefined sources in sufficient quantities to contribute to the problem of pollution .
The magnitude and the extent of non-point source pollution can be evaluated long term on-site monitoring and simulation modeling. Due to the resource constraints associated with on-site measurements, simulation have frequently been relied upon to provide guidelines in developing and implementing pollution control programme. There are several no-point source pollution assessment models and Agricultural Non-point source (AGNPS) pollution model selected for the study is a widely used single storm event based model. It simulated runoff. Sediments and nutrient transport form agricultural catchments . the model consists of three components namely, hydrology, erosion and sediments, and chemical transport and operates at the user-defined cell resolution .
Non-point source pollution modeling requires as extensive knowledge about the land use, soil, slope, agricultural activities and the socio-economic background of the area. The remote sensing and Geographical information system (GIS) with its spatial analysis capabilities facilitate handling these large quantities of spatially varying data required for pollution modeling in catchments.
Approach
This study was carried out at an important sub catchment called Nilambe in the central part of Sri Lanka. This area is highly degraded and consists of very steep slopes and eroded soils . there are three major development products on domestic water supply, hydropower generation and irrigation implemented at Nilambe. The success of these projects mainly depend on the yield and the quality of water . hence, the importance of identifying the potential non-point sources of pollution to the water bodies is understood and the need for creating awareness among the people and implementing remedial measures to protect te land, water and human resources is emphasised.
The main objective of this study was to apply AGNPS model to the Nilambe catchment through the integration of remote sensing and GIS in order to identify the non-point source pollution risk locations. There are 22 input parameters required by the model and among them, five impute parameters and directly dependent on ht eland use and cover. Tehrefoere, it is important to identify the existing conditions of land use and cover for model simulations and also to make provision for updating land use and cover to represent the dynamic status with time. Indian Remote Sensing Satellite (IRS LISS II) imagery acquired in March, 1992 was used to derive the land use and cover map of the area using the supervised classification techniques. The nest there band combination for display purposes was identified using optimum Index Factor (OIF) approach ( Dwivedi and Rao, 1992) which involves the variation and correlation among different bands. Six land use and cover categories were included in the legend for the land use and cover map derived from the imagery ( figure 01 ). Five model parameters namely, surface condition constant, Manning's roughness coefficient, runoff curve number, cover and management practices factor in universal soil loss equation and Chemical Oxygen Demand (COD) factor were derived based on the land use and cover. The slope, slope aspect and slope length were derived using 1;50,000 topographic map sheets. Soil textural information was extracted using 1:10,000 soil map along with the associated information obtained through field investigation.
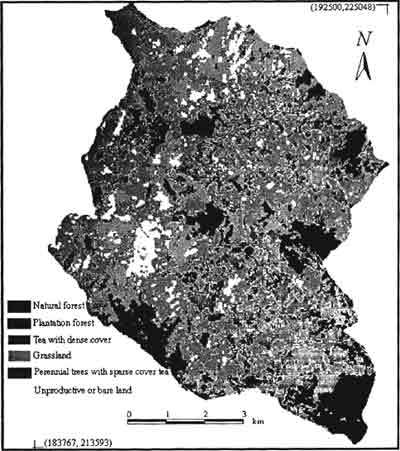
Figure 1 Land use and cover map produced from supervised classification of IRS LISS II imagery
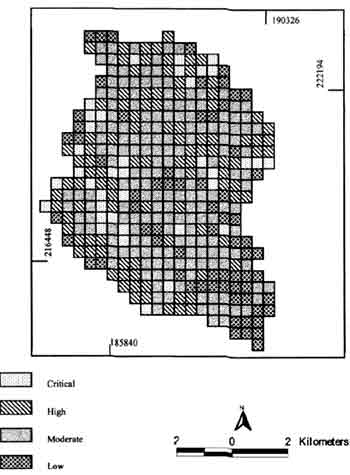
Figure 2 Identified zones based on sediment production
AGNPS Model Functionality
The AGNPS model operates on cell by cell basis and accordingly, the area was divided into 40 acre cells. Model parameters for the cells were entered into the model through the integration of GIS wearer each parameter was derived and mapped individually. Since there were no recording type rain gauges located within the study area, it was not possible to calculate the energy intensity values. Therefore, the simulations were made for some selected rainstorms ranging form 0.9 to 8 inches.
The model results were obtained for the sedimens and pollutants in terms of the production of COD, nitrogen and phosphorus and the catchment was zoned based on the magnitude of the pollutants generated by each and every land parcels. According to the results of four inch, two hour rain storm, four zones based on the sediments production capability and three zones based on the nitrogen and phosphorus production capability were identified. The identified zones are presented in Figure 02 and figure 03, respectively.
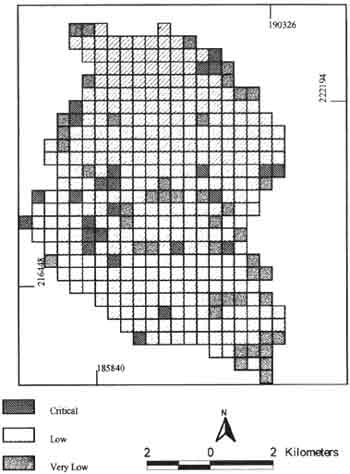
Figure 3 Identified zones based on nutrient production
The selected rainstorm provides estimates of pollutant loads only for that particular rain storm . the simulation was extended for the 171 rainly days found in the hydrological year 1991/92. the rainfall events which are greater that 0.8 inches were taken to calculate the annual pollutant loads of he catchment. These rain storms were divided into eight categories maintaining thresholds at 0.8, 1.1, 1.4, 1.6, 1.7, 2.0, 2.4 and 2.75 inches. The simulated results for each and every rainstorm category were multiplied by the number of storm events belonging to each category to calculate the total annual sediment production .
The calculated total sediment production for the hydrological year 1991/1192 was about a tons/hec. The Environmental and forest consecration division of Mahaweli Authority has obtained a value of 0.6 tons per hectare for the sediment yield in the hydrological year 1991/1992. although the predicted sediment yield is almost six times higher than the measured value, the results are acceptable due to number of reasons. The measurements have been conducted during duty periods nad the rock boulders across the Nilambe river from pools in different locations which can trap sediment during medium and low river dischagers. Further, the measurements have confined ot suspended sediments only and neglected the bed load component. The possibility of having high sediment yields as predicted by the model is confirmed by Fleddeermann and watusawithanan (1993) at Moolgame which is located within the study area. According to the result, plots without sloping Agricultural Land Technology (SAIT) have shown a soil loss of 1.4 tons per hectare during Maha season.
SALT as a management Practice
SALT is one of the widely used Best Management Practices (BMPs) in Upper Mahaweli Catchment Area which include Nilambe sub catchment. In this technology, soil erosion in sloping agricultural lands is minimized by cultivating the crops along the contours and tar4apping the sediment by hedgerows. In this study, SALT conditions were simulated at the critical locations to predict the sediment and nutrient production in order to identify the capability to BMOs in no-point source pollution control. The application of SALT has shown a considerable improvement in controlling land degradation and pollution in the aspects sediment, nutrient and COD production. Accordingly, the areas belonging to the critical pollutant production category have reduced to nearly 32 hectares in terms of both sediment and nutrient production. The spatial demarcation of sediment and nutrient production zones after applying SALT are presented in Figure 04 and Figure 05.
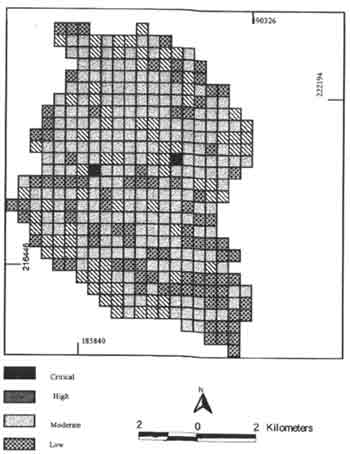
Figure 4 Identified zones based on sediment production
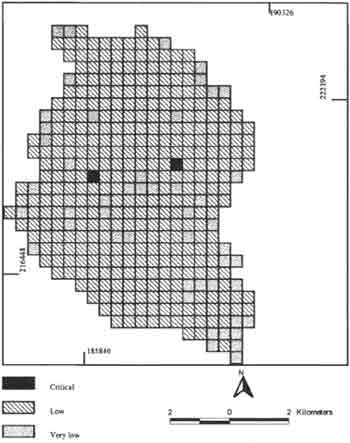
Figure 3 Identified zones based on nutrient production afterapplying SALT
Conclusions
The AGNPS model provides acceptable estimates of on-site soil erosion, sediment yield, production of nitrogen, phosphorous and chemical oxygen demand. Te comprehensive nature of the model output gives the capability of assessing quality of sediment and runoff at any point of catchment and also at the catchment outlet. This facilititates zoning and identifying critical and non-critical location. Further, it is concluded that the model is well suited for comparison among defferent land parcels in terms of the amount of pollutants appropriate technology for managing the land while reducing sediment and nutrient imagery in the identification of land use and cover dynamics and simulate the model for the changes in pollutant production accoding to the changes of land use and land cover. Identification of the more suitable grid size instead of the used 40 acre grid size is also important to obtain more realistic modelling results in addition to the detailed investigation of the pollutants within a single cell.
References
- Dwivedi, R.S. & Rao, B.R.M. (1992). The selection of best Landsat TM band combination for delineating salt-affected soil, Int. J. of Remote Sensing, Vol. 13 No. 11 2051-2056.
- Fleddermann A. & WJarusawithana, T.C. (1993). Soil erosion studies in Moolgama, Upper Mahaweli Environment & Forest Conservation Division, MASL..