| GISdevelopment.net ---> AARS ---> ACRS 1997 ---> Coastal Zone/Oceanography/Meteorology |
Conception of Qualitative and
Quantitative Classification of Mangrove Forest with TM Data of Landsat
Kazuhiro Sato*, Minoru Nakajima** and Takashi Hoshi***
*College of Agriculture, University of the Ryukyus,
Senbaru 1, Nishihara, Okinawa 903-01, Japan
Tel. 81-98-895-8792, Fax. 81-98-2864
**Omodaka Electronics Co.,Ltd., 101 Column Otsuka,
Otsuka 4-43-9, Bunkyo-Ku, Tokyo 112, Japan
Tel. 81-3-3944-8661, Fax. 81-3-3944-8972
***Faculty of Engineering, Ibaragi University
Nakanarisawa 4-12-1, Hitachi, Ibaragi 316, Japan
Tel. 81-294-38-5133, Fax. 81-294-37-2223
Abstract
Qualitatively and quantitatively classified and overlaid map of a forest is more useful for the management and control of the forest. The conception to make such classification map for mangrove forest with TM data of Landsat 5, was investigated in this paper.
A mask procedure with band 4 and 5 was used for extraction of mangrove area. The mask data made by binarization to give zero to mangrove area and 255 to the outside, was added to the data of each band.
Count and indexes showed a significantly high correlation coefficient among stand parameters, and several regression equations were shown. In those equations, Remote Sensing data were independent variables and stand parameters were dependent variables.
A conception of quantitative classification is shown in Fig.-2 and Fig.-3. The qualitative classified result in Fig.-1 becomes the material of six masks for each category. As the premise of this conception, it is necessary to make clear relationships between Remote Sensing data and stand parameters based on the field survey, and to be given regression equations for each classified categories. Estimated value for each pixel is compared with the class ranges and given a fit color, and summed up for calculation of total and mean value. These data keeping original value for only mangrove area were used for the classification of species groups and estimation of stand parameters such as tree height, diameter at breast height, trunk volume and stand volume. Major nine groups of Avicennia, Bruguiera, Excoecaria, Heritiera, Nypa, Rhizophora, Sonneratia, Xylocarpus and the other for the classification and eight groups to make one with Bruguiera and Rhizophora for estimation of stand parameters were recommended.
In this conception, there were two kinds of mask procedure. One was for extraction of only mangrove area and the other was for preparation of data sets to estimate separately stand parameters of each classified group.
Although correlation and regression between stand parameters and TM data or calculated indexes from Tm data were described for Bruguiera and Rhizophora, the investigation of relationships between stand parameters and TM data for groups was remained as a problem in the future.
Overlay of isopleth figures of a stand parameter to qualititatively classified map was suggested as a conception. It was useful to know simultaneously qualitative state of a mangrove forest.
Introduction
There are two types of information on a forest. One is qualitative it such as species composition or stand condition which is expressed as a forest type map, and the other is quantitative it such as tree height, diameter at breast height, trunk volume, stand volume and so on. Both of them are important for management and control of the forest.
It has been understood widely in recent years that mangrove forest is important as a coastal ecosystem. The International Society for Mangrove Ecosystems (ISME) published World Mangrove Atlas 5). In this atlas mangrove forests in the world were extracted with Remote Sensing technics, and the extent of them was summed up and shown as a table by regions and the distribution of them also was shown in many regional maps. By Remote Sensing, it is possible to realize extraction of mangrove forests in the world with the data for about one year and the same procedure. In future, it is considered that the importance of information in mangrove area ought to increases and it is expected to be not only extraction of the area but also qualitative and quantitative information.
Fundamental investigation has been continued to apply Remote Sensing to mangrove area because the authors had deeply understood the importance of its as a coastal ecosystem and difficulty of field survey depend on the inconvenient situation. A mask procedure was suggested as a pre-procedure for effective classification of mangrove area to pay attention to the properties as swampy situation3,4). This mask procedure makes preparation of separated three data sets for mangrove area, land area and waters. As mangrove area is separately classified from the outside, classification of it can be avoided error resulted from the outside pixels which have similar spectral reflectance characteristic. Relationships between TM data of Landsat 5 or calculated indexes from cleat that CCT count of band 4 and several indexes showed significantly high correlation coefficient among stand parameters, and regression estimation of them was possible by these Remote Sensing data.
Among some problems are remained for species groups without Bruguiera and Rhizophora, conception to show simultaneously qualitative and quantitative information for mangrove area is investigated in this paper.
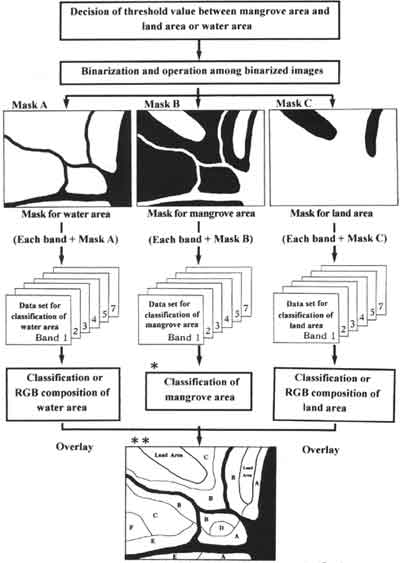
Fig.-1 Conception of masking and procedure of qualitatie classification
(from A to F indicate qualitative categories of mangrove forest)
Qualitative classification
As qualitative categories for a forest, there are stand age such as young stand, immature stand, mature stand and over matured stand, growing stage, site quality and so on. But the most important qualitative information may be tree species composition. If mangrove forest is controlled as a coastal ecosystem or is utilized as resources it is fundamental.
In Ishigaki and Iriomote region in Okinawa, Rhzophora stylosa and Bruguiera gymnorrhiza are dominant species, and the others of seven species have never occupied area covered with one pixel of TM data of Landsat 5. In Okinawa main inland Kandelia candel is added to the dominant species.
Although the authors had reported the mangrove forest in the river mouth of Fukido-gawa River in Ishigaki Island was classified to three parts of R. stylosa dominant stand, B. gymnorrhiza dominant stand and mixed stand with both species using airborne MSS data 6), and also it was pointed out the possibility to classify above two species was small using TM data of Landsat 52).
If it is possible to classify mangrove species, followings are expected to be separated as nine categories from points of view of forest ecology, management and control or utilization of mangrove forest; Avicennia, Bruguiera, Excoecaria, Heritiera, Nypa, Rhizophora, Sonneratia, Xylocarpus and the others. Difficulty of separation among species among species in a family can be forecasted in consideration of a pixel size of Remote Sensing data and the similarity of spectral reflectance characteristics of the crown layer.
The conception of qualitative classification of mangrove area using TM data of Landsat 5 is shown in Fig.-1. This was previously suggested in our papers3,4). In this figure, six categories are supposed as six species groups of mangrove in a mangrove area. For band 4 and 5 , threshold values between land area, water area and mangrove area are decided with a key of CCT count profiles to intersect mangrove area from land area to water area. Binary images as three masks can be made with correspondence of target area to zero and the others 255. A data set keeping data in only each area can be made by addition of each mask to the data of all bands. Suitable classification method is applied for the classification in this mangrove area using the data set. The qualitative classified result is quite free from the obstruction caused by the outside pixels to have similar spectral reflectance characteristic. This procedure is completed by overlay of two outside results classified or composed with RGB.
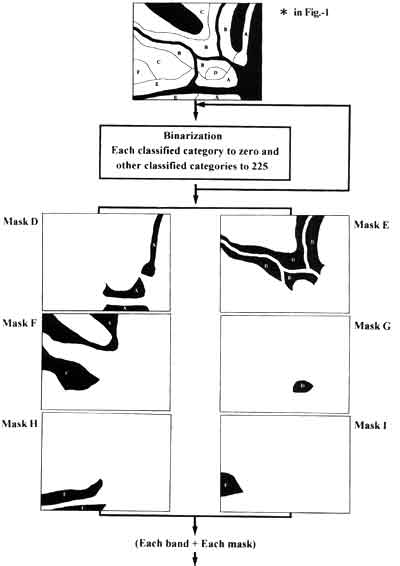
Fig.-2 Conception of masking for quantitative epression and folowing procedure
Quantitative classification
One of the authors had investigated relationships between Remote Sensing data and stand parameters such as mean volume of tree height, diameter at breast height, trunk volume and crown area, and stand volume of mangrove forest in Okinawa with other researches 1,2). In the papers, CCT count of band 4 of TM data of Landsat 5, calculated indexes such as B1/B4, B2/B4, B4/(B3+B1), B4/(B3+B2), (B4-B1)/B4+B2, (B4-B3)/B4+B3 and so on had been given as CCT count and indexes showed a significantly high correlation coefficient among stand parameters, and several regression equations were shown. In those equations, Remote Sensing data were independent variables and stand parameters were dependent variables.
A conception of qualitative classification is shown in Fig.-2 and Fig.-3. The qualitative classified result in Fig.-1 becomes the material of six masks for each category. As the premise of this conception, it is necessary to make clear relationships between Remote Sensing data and stand parameters based on the field survey, and to be given regression equations for each classified and summed up for calculation of total and mean value.
Qualitative and quantitative simultaneous expression
It is difficult to overlay colored quantitative classification map to the colored qualitative classification map, so in Fig.-3 it is suggested to overlay isopleth figure of a stand parameter for each category to the colored qualitative classification map. If the isopleth figure becomes complicate, it is better to use a suitable smoothing.
As it should be easy to understand simultaneously qualitative and quantitative state of a mangrove forest by such complex map, it ought to become useful and fundamental material for management and control of the mangrove forest.
There are not so many reports for quantitative estimation of stand parameters of mangrove forest using Remote Sensing techniques because there are many difficult conditions for the field survey. But remained major problem is establishment of regression estimation of stand parameters. If our effort is concentrically put into the point, the solution of this problem should not be so far.
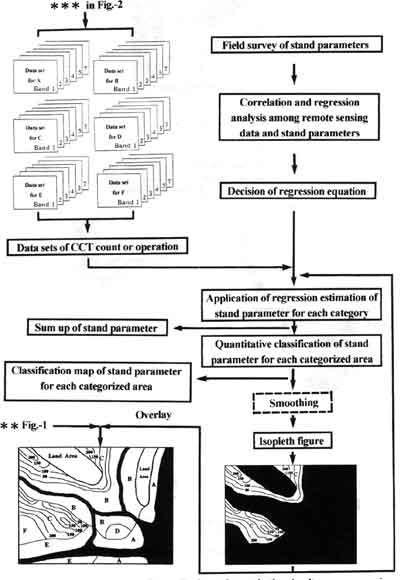
Fig.-3 Conception of procedure for qualitative and quantitative simultaneous expression
(only isopleth figure for category C is shown to avoid complication)
References
- Dwi Setyono, Kazuriho Sato and Yoshihiro Kohda: Relationships
between TM data of Landsat 5 and Stand Parameters on Mangrove Forest in
Okinawa, Journal of the Japan Society of Photogrammetry and Remote
Sensing, Vol.36, No.2, 4-12, 1997.
- Dwi Setyono, Kazuriho Sato and Yoshihiro Kohda: Relationships
between TM data of Landsat 5 and Stand Parameters on Mangrove Forest in
Okinawa, Journal of the Japan Society of Photogrammetry and Remote
Sensing, Vol.36, No.3, 6-12, 1997.
- Kazuhiro Sato, Dwi Setyono and Kenshi Takezaki: Mask Procedure for
Effective Classification and Expression on Mangrove Area with TM data of
Landsat 5, Proceedings of the 16th Asian Conference on Remote Sensing,
P-7-1-6, 1995.
- Kazuhiro Sato, Minoru Nakajima and Takashi Hoshi: Mask Procedure for
Effective Classification and Expression on Mangrove Area and a Method to
Decide Threshold Values with TM data of Landsat 5, Proceedings of the
17th Asian Conference on Remote Sensing, WS-1-1-6, 1996.
- Mark Spalding, Francois Blasco and Colin Field: World Mangrove
Atlas, The International Society for Mangrove Ecosystems, Okinawa,
1997.
- Takashi Hoshi and Kazuhiro Sato: Analysis of Mangrove Forest in
Okinawa using airborne Remote Sensing Data, Proceedings of the 6th Asian
Conference on Remote Sensing, 381-390,
1985.