| GISdevelopment.net ---> AARS ---> ACRS 1997 ---> Coastal Zone/Oceanography/Meteorology |
Aerosol Optical Depth Derived
From Spot Data
Tang -Huang Lin, Gin-Rong
Liu, and A.J. Chen
Center for Space and Remote sensing research
National central University, Chung -Li320, Taiwan, ROC
Tel : (886) -3-4257770 Fax : (886)-3-4255535
E-mail: ajchen@csrsr.ncu.edu.tw
AbstractCenter for Space and Remote sensing research
National central University, Chung -Li320, Taiwan, ROC
Tel : (886) -3-4257770 Fax : (886)-3-4255535
E-mail: ajchen@csrsr.ncu.edu.tw
By assuming the ground reflectance being invariant in time, variations of satellite signal may be attributed to variations of the atmosphere optical properties. Based upon this, tanre et al. (1988) has defined ht structure function for deriving aerosol optical depth from TM images. Holben et al. (1992) also has gotten the similar results by using AVHRR data. in this paper , the structure function method is applied to SPOT data, which has high spatial resolution. The results of this study are reasonable when compared with the dense Dark Vegetation methods results. In general, the error of aerosol optical depth determination could be attributed to the different pattern of structure function distribution, which is caused by the characteristics of local land covers, terrain and the high resolution property of SPOT data and should be removed in the future.
Introduction
the main factor of atmosphere effects in the visible band is affected by the aerosol. Since the parameters of aerosol are rather difficult to estimate, many methods for determining the aerosol parameters have been discussed in past researches. For example, an image-based of retrieving aerosol characteristics by the dense Dark Vegetation ( DDV) method to correct the atmospheric effect of image itself was presented by Liu et al. ( 1996). In their method, the large error could happen when there are few DDV pixels in the image. if we assume the ground reflectance to be invariant in time, variations of satellite signal may be attributed to the variations of atmospheric optical properties. Based upon this, one method of multi-temporal aerosol parameters retrieval by a reference ground measurement was accomplished by Tanre et al . ( 1988).the structure function is defined in their study for deriving aerosol optical depth from Landsat TM data. Holben et al. (1992) also food good result by applying structure function method to NOAA AVHRR data. in this study, structure function method is applied to high resolution SPOT data in northern Taiwan area and can obtain the reasonable distribution of aerosol optical depth over the whole image.
Methodology Review
the apparent surface reflectance observed at satellite level can be described as below ( Tanre et al ., 1988)
r* ( ms, mv , j) = ra (ms, mv, j) + {T(ms) [rexp[-t/mv]+<r>td (mv)]}/ (1-<r>s)
where ra is atmosphere reflectance, r is surface reflectance, ms and mv are cosines of solar and sensor's zenith angle, respectively , j is relative azimuth angle between the sun and sensor. t is atmospheric optical depth, T is total transmittance between the sun and surface, td is diffuse transmittance between and sensor and s is atmosphere albedo .
Consider two pixels ( i, j) and ( i, j+d) not too distant, so that we may reasonably assume that <ri,j+d>=<pi,j>. if the multi-reflection between atmosphere and surface is neglected, the difference of reflectance between these two pixel is:
Dr*i,j =Dr*i,j T (ms) exp [ -t / mv] (2)
where i, j are the line and sample of image, d is the distance of neighbor pixels.. Assuming the surface reflection remaining unchanged , i.e. Dri,j, = constant, ta ( aerosol optical depth ) increases when Dr*I,j decreases. The Dr*i, j, is a function of ta. the structure function, M is defined by Tanre as:
M2 (d) = SiSj(ri,j,----ri,j+d)2/N (3)
Where N is the total number of difference calculated substitute Eq. (3) into Eq (2) and get:
M*2 (d) = M2 (d) T2 (ms) exp [ -2t/mv] (4)
Where M* is the structure function observed at satellite level. Applying satellite data of sequential time, t1, t2, to Eq. (4). By assuming the surface reflectance being invariant in time we can get:
(M*2 (d, t1) / (M*2 ( d,t2) =( T2( d,t1) exp [-2 t (t1) / mv] ) / (T2 (d,t1) exp [-2t (t2/ mv )]) (5)
If the aerosol optical depth if t2 is known , the aerosol optical depth of t1 can be obtained from (5) also shows that the different distance, d, may have different value of retrieval aerosol. In general, the ratio between tow different images in time is determined by the linear relationship of the two structure functions, ranging from d=1 to d=10. so, the low correlation between structure functions would enlarge the error of aerosol estimation . generally, SPOT data, which have high spatial resolution than TM or AVHRR data, are more sensitive than TM or AVHR data on surface structures or local coverage change.
Results
Seven SPOT images, acquired on Mar. 7, Apr. 3 , Jan 28, Aug. 10, Aug. 31, Sep. 16, and Sep. 26 in 1994, are used to retrieve aerosol optical depth in this research. The geometrical conditions are shown in Table 1. the atmospheric transmittances are provided form radiosonde data at near-by station, Ban -Chiu. The referenced aerosol optical depth is obtained by DDV method ( Liu et al 1996) for lack of ground measurements during the time of interest. Three test areas, of which each includes 35*35 pixels, are selected near National Central University (figure 1). The structure function distributions of SPOT channel 1 data ( XSI) in each area are illustrated in figure 2. differences of distribution pattern between two difference area Ar apparent and mostly caused by different landcovrs.
Table 2 shows the results of aerosol optical depth by DDV method and structure functions method. General speaking, both results are consistent, except mar .7 and Sep . 26 . usually, the vegetable canopy of DDV in the northern Taiwan area in rice paddy. Early March is the sedding period and latter September is the grown-up period of rice paddy in the northern Taiwan. The images of the north Taiwan during these tow periods always contain few DDV pixels, which are not sufficient for the DDV method. As the distribution of atmospheric aerosol in non-uniform, the optical depths, indeed, are different in 3 test areas. Is also noticed that the optical depths of XS2 and XS3 area consistent among 3 test area. However, the optical depths of XS1 in area 2 for June 28, August 31, September 19 and 26 are substantially different form those in area 1 and area 3. in computing the optical depth, the reference date is chosen when its structure function is chosen on August 10, its structure function at area 2 is not maximum. As results, the optical depths in area 2 behave quite differently. This phenomene remains unclear.
By using structure function method, we can obtain local aerosol parameters and distribution over the whole image. the distribution of retrieval aerosol optical depth from XSI data on Aug. 31, 1994 is shown in figure 3 and the histogram if distributions is depicted in figure 4. the aerosol optical depth between 0.3~0.5 is about 70%. So, the structure function method can not only be applied to the images which contain few DDV pixels, but also improve the assumption of aerosol distribution uniform in whole images by the DDV method.
Discussion
The results of applying SPOT data to retrieve the local aerosol optical depth appears to be very promising. The structure function method has tow advantages, compared with the DDV method: (1) it doesn't need DDV pixels, (2) it can obtain the distribution of aerosol optical depth over the whole image. However, the disadvantages of the structure function is that one ground measurement is needed as reference.
The complex terrain and landcovers of Taiwan area can not be described completely by the single -directional structure function, which is defined by Tanre, especially for the high spatial resolution remote sensing images. Thus, the multidirectional structure function is considered in the future. On the other hand, the accuracy of aerosol retrieval may be affected by; the distribution pattern of structure function which may be caused by the characteristics of surface reflection, terrain, and high spatial resolution of remote sensing data and should be removed in the future as well .
Reference:
- . Holben B., E Vermote, Y.J. Kaufman , D. Tanre, and V. Kalb, 1992:
Aerosol aretrieval over land from AVHRR data-application for Atmospheric
correction IEEE Trans on Geoscience and Remote Sensing , Vol 30, No. 2,
212-222.
- . Liu C.H., A.J. Chen and G.R.Liu , 1996 : An images based retrieval
algorithm of aerosol characteristics and surface reflectance for
satellite images. Int. J. Remote sensing , Vol . 17, 3477
-3500.
- . Tanre D., P.Y. Deschamps, C. Devaux , and M. Herman, 1988 ;
estimation of Saharan aerosol optical thickness from blurring effects in
Thematic Mapper data , J. Geophys Res., PP 15955-15964.
- . Kneizys, F.X , E.P. Shettle. L.W. Abvreu, J.H. Chetwynd, G.P.
Anderson, W.O. Gallery , J.E. A . Selby and S.A. Clough, 1988. Users
guide to LOWTRAN 7, Report AFGL-TR-88-0177, Air Force Cambridge Research
Laboratories, Bedford, MA.
| Date | Solar | Satellite sensor | ||
| Zenith | Azimuth | Zenith | Azimuth | |
| 1994/03/07 | 36.3 | 145.1 | 3.26 | 193.2 |
| 1994/04/03 | 29.5 | 129.1 | -28.2 | 193.1 |
| 1994/06/28 | 19.7 | 89.9 | -24.8 | 193.2 |
| 1994/08/10 | 19.2 | 114.4 | 6.6 | 193.2 |
| 1994/08/31 | 23.2 | 128.3 | -0.9 | 193.2 |
| 1994/09/19 | 28.2 | 139.4 | -15.1 | 193.1 |
| 1994/09/26 | 29.7 | 146.7 | -0.9 | 193.2 |
| Aerosol optical depth of SPOT XSI | ||||||
| Date | DDV method | Structure Function method | ||||
| Area1 | Area2 | Area3 | Mean | Std. | ||
| 1994/03/07 | 1.59580 | .739 | .750 | .761 | .750 | .008 |
| 1994/04/03 | .65540 | .624 | .616 | .609 | .616 | .006 |
| 1994/06/28 | .44530 | .528 | .385 | .470 | .461 | .059 |
| 1994/08/10 | .40840(ref) | .434 | .434 | .434 | .434 | 0 |
| 1994/08/31 | .45690 | .591 | .120 | .485 | .399 | .202 |
| 1994/09/19 | .43140 | .645 | .007 | .478 | .377 | .270 |
| 1994/09/26 | .12990 | .604 | .056 | .424 | .361 | .228 |
| Aerosol optical depth SPOT XS2 | ||||||
| Date | DDV method | Structure Function method | ||||
| Area1 | Area2 | Area3 | Mean | Std. | ||
| 1994/03/07 | 1.34590 | .687 | .707 | .737 | .710 | .020 |
| 1994/04/03 | .55160 | .557 | .542 | .575 | .558 | .013 |
| 1994/06/28 | .37270 | .499 | .320 | .360 | .393 | .077 |
| 1994/08/10 | .53640(ref) | .428 | .428 | .428 | .428 | 0 |
| 1994/08/31 | .37810 | .428 | .507 | .434 | .456 | .036 |
| 1994/09/19 | .34020 | .451 | .505 | .357 | .438 | .062 |
| 1994/09/26 | .08430 | .436 | .526 | .365 | .442 | .066 |
| Aerosol optical depth SPOT XS3 | ||||||
| Date | DDV method | Structure Function method | ||||
| Area1 | Area2 | Area3 | Mean | Std. | ||
| 1994/03/07 | 1.03050 | .674 | .652 | .675 | .667 | .010 |
| 1994/04/03 | .42080 | .533 | .461 | .518 | .504 | .031 |
| 1994/06/28 | .28190(ref) | .285 | .285 | .285 | .285 | 0 |
| 1994/08/10 | .82270 | .527 | .469 | .456 | .484 | .031 |
| 1994/08/31 | .28100 | .458 | .417 | .424 | .433 | .017 |
| 1994/09/19 | .23440 | .285 | .303 | .307 | .298 | .010 |
| 1994/09/26 | .04280 | .267 | .283 | .358 | .303 | .039 |
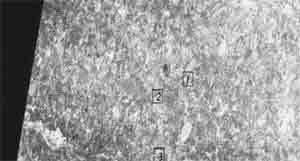
Figure 1 the locations of test area 1,2 and 3 on the SPOT images , around Shin -Wu in the northern Taiwan
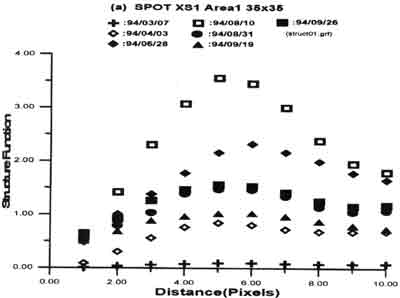
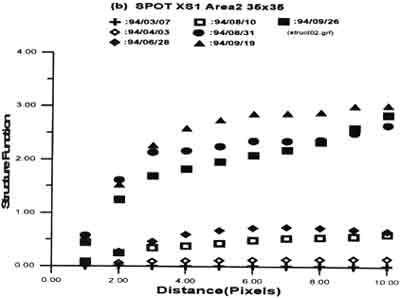
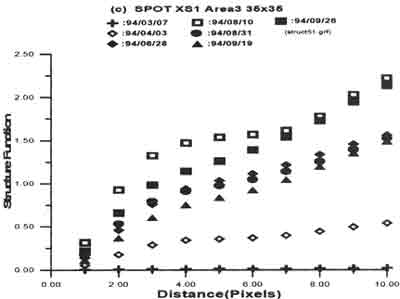
Figure 2 The distributions of structure function of SPOT XS1 in (a) area 1, (b)area2 and (c) area3
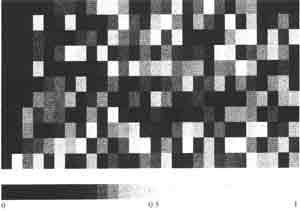
Figure3. The distribution of retrieval aerosol optical depth SPOT XSI images August 31, 1994.
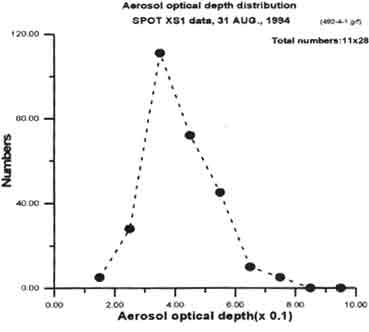
Figure4. The histogram distribution of Figure 3