| GISdevelopment.net ---> AARS ---> ACRS 1997 ---> Mapping from Space |
Effects of Interference noise
with down link signal from JERS-1 Satellite on Thailand Receiving Ground
Station
Saowanne Thongthammachart,
Kobachai Dejhan and Fusak Cheevasuvit*, Chanchai
Pienvijarngpong**
*Telecommunications Engineering Department, Faculty of Engineering
King Mongkut's Institute of Technology Ladkrabang
Chalongkrung Road, Ladkrabang, Bangkok 10520
Tel (662) 3269967 , (662) 3269081, Fax (662) 3269086
Email: kobchai@telelan.telecom.eng.kmitl.ac.th
**NRCT, MOS-I Receiving Ground Station
Chalongkrung Road, Ladkrabang, Bangkok 10520
Abstract
The JERS-1 downlink transmitted signal from JERS-1 satellite is continuously received at Thailand Receiving Ground Station and the image characteristics of this signal have been abnormal exhibited (especially this abnormal recurs in the same orbit and same direction). A statistical study bases on a long-term (five months after finding some abnormity) observational data has strongly suggested that is abnormally was not coincidental, but is highly to be related to effect of external noise. The results from a computer show the status of X-band, S-band and satellite tracking of receiver antenna. The effect of this interference noise are discussed.
Introduction
In Thailand, the significance of the satellite remote sensing data has also been recognized by the government, individual, and the academic community, where it is often discussed with "Application of Remote Sensing data" [2]. Various researches and development activities have been disseminated.
Under this circumstance, in 1992 the NASDA and NRCT cooperate to construct the JERS-1 Satellite Receiving Ground Station in Thailand [1], it continuously receives, and after December 1996 some characteristic of image data have exhibited abnormal which abnormally to be relate to external noise. This paper presents the effect of interference noise to downlink signal of JERS-1 Satellite. This study is conducted during January to May 1997. In order to provide the necessary framework for appraising the experimental data, the following topics are also included in this paper JERS-1 satellite system overview, radio noise, noise detection and procedure, a brief of e ffect of interference noise to downlink signal [3].
JERS-1 Satellite Overview
The Japanese Earth Resources Satellite-1 (JERS-1)[4] efficiently collectes global earth resource information and to conduct the active observations for national land surveys, agricultural and forestry surveys, environment preservation, disaster prevention, and activities. The JERS-1 observation system can be roughly divided into a space segment and ground segments. The space segment includes the tracking, controlling system, the acquisition and the processing system. The JERS-1 carries two pieces of observation equipment, the synthetic aperture radar (SAR) and optical sensor (OPS) collecting data with the missioning recorder.
SAR is a sensor that transmits microwave signal and receives their reflection from the target, in spite of the weather conditions. SAR has high resolution in the range direction using the pulse compression technique and in the azimuth direction with the synthetic aperture technique.
OPS observes in seven spectral bands, from visible to the short wave infrared and it is capable to stereoscopic observe with a forward look of 15.3" from nadir in the near infrared band. It can be used to identify soil, rocks, minerals, vegetation, and water. Figure 1 shows the JERS-1 satellite configuration.
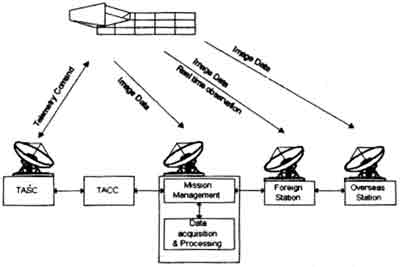
Figure 1 JERS-1 satellite configuration
Radio noise
All communications systems concern with signal that are contaminated to degree by noise. Since some minimum signal-to-noise ratio needs fro successful operation, noise may well be the factor which limits system performance. Noise originates both in the receiver of communications system and externally to the receiver. The concepts concerning noise are basic to any quantitative treatment of telecommunication and remote sensing system. In this paper, we discussed to the external noise to associate with problem on Thailand Receiving Ground Station.
In the vicinity of metropolitan areas man-made noise and interference may be more intense in the LF through UHF bands than natural noise. The subject of nose and interference is complex. Many detail studies are reported in the transaction of the professional group on electromagnetic compatibility and in symposium records of this same group [5]. An antenna may receive noise and interference in the minor lobes of its pattern in the main beam.
Another type of noise, intermodulation noise, is generated in the active electronic circuit if telecommunication systems, but this topic is not treated here, and the reader refers to references such as those by the Bell Telephone Laboratories [6] and GTE Lenkurt [7].
Path Clearance and Reflections
The microwave system not only clearance for the direct, straight path from transmitter to receiver but for 0.5 or more of the first Fresnel zone as well. The actual clearance requires in term of distance from the direct path it is also be a function be a function of te amount of atmospheric refraction.
Figure 2 Geometry for consideration of Fresnel zones
Consider two paths as shown in Figure 2 TPR is the direct path, and TSR is longer than TPR. If TSR = TPR+l/2, where l is the microwave wavelength, the region within the radius r of the direct path, at the distance of dT from T and dR from R, is defined as the first Fresnel zone. The particular value of r in this case it can be designated as F1, the first Fresnel zone radius. The concept can be extended to the case to the case when TRS=TPR+n+l/2, for which the corresponding Fresnel zone radius can be designated as Fn. Radiation passing through the first Fresnel zone tends to add in phase; radiation passing through the second Fresnel zone (between F1 and F2) tends to interfere destructively with radiation passing through the first Fresonl zone and etc. The tendency for constructive or destructive interference can be understood in term of Huygen's principle, which states that every point on a wave from can be regarded as source of secondary spherical wavelets. IT can be shown that he radius of the first Fresnel zone F1 is given with all lengths in meters by:
F1 = Ö((ldTdR )/D) (1)
Where d = dr+ dR, or
F1= 17.3 Ö((dTdR )/fd) (2)
if the distance are measured in km, f is measure in GHz, and F1 is measured in m.
Another factor which needs to be considered when energy reflected from a surface reaching to a receiving antenna, in additional to traveling energy through the atmosphere, is the fact that when reflection takes place closely grazing incidence a shift in phase closely 180° takes place upon reflection for both horizontal and vertical polarization. Thus, a signal reaches the receiving antenna by having been reflected by a surface at distance F1 from the direct path will be in phase with a signal traveling over a direct path. The two phase shift of 180°, one due to reflection and the other due to the increase of path length, cancel out and reinforcement results. For a path length difference of l corresponding to F2, the destructive interference takes place.
The case of interference between the direct and reflected rays can be handled without reference to Fresnel zone a such. Consider the depicted case in Figure 3, where a transmitter height hT and a receiver height hR are shown above a flat earth. The difference inphase between the signal following the direct path of length r1 from T to R and the reflected rays due to two factors; the difference in path length and the change in phase of reflection.
The relation between r1, r2, d, hT, and hR are
r12 = (hT-hR)2 + d2 and r22 = (hT + hR)2 + d2 (3)
As (hT + hR) and (hT - hR) are small when compared with d,
r1 = d + ((hT - hR)2 )/2d
r2 = d+ (hT+ hR)2 /2d (4)
then r1 - r2 = (2hThR )/d (5)
The corresponding phase difference
q = (2p (r1 - r2))/l = (4pThR )/ld (6)
But the phase of the traveling signal for the length r2 is reversed on reflection, so the total phase direction f is given by f = q + p. The phasors represents two signals C and D witɨ corresponding to r1, and r2 respectively the change of phase as shown in Figure 4 as one possible relative position.
Because of the reversed polarity on reflection however C and -D are to be summed. In terms of the angle q the summation gives
E = (2E0 sin ((2phThR)ld))/|d| = (2E0 sin (q/2))|d| (7)
for the case-that the arriving signals over the two paths would cause each field intensity E0 at r = 1 m in the absence of the other. The first maximum expression is in a function of q occurring when q/2 = p/2, or hThR = ld/4. It gives the maximum value of hThR that can be used to obtain the maximum signal.
Noise detection and procedure
Having monitored the status of X-band, S-band, and satellite tracking of the antenna at real time receiving by the computer. The abnormal of receiving signal status is carry out and they are classified into 2 types with respect to the X-band status; (1) X-band locks off and noise appear on image data (2) X-band locks on according to the appearing noise on image data. A statistical study for 5 months after noise occurred, it has been observed the collected data. It is obviously that the collected data of noise effect recur in same satellite orbit and same direction and this effect occurred at low elevation angle of receiving antenna. The observed data are likely to be related to the external noise [5].
The amplitudes of JERS-1 satellite downlink signal at real-time have been measured. The SNR were monitored by according the automatic gain control output signal (signal plus noise) of a receiver. A typical recording shown as in Figure 6 is used for the entire of 8 GHz band. The variations dBm from average is not unusual. The record SNR on the log sheet is an estimated average.
The effects of interference noise change the physical characteristics of image data as shown in Figure 5.
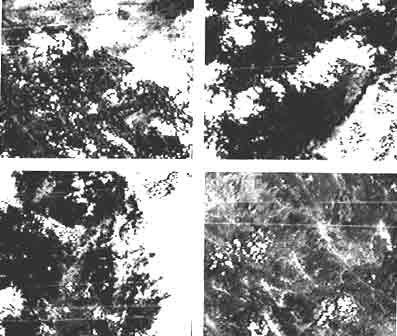
Figure 5. Effect of interference noise to chance the characteristics of JERS-1. Satellite image data.
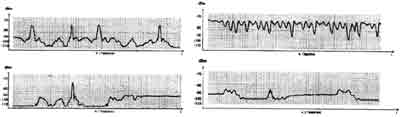
Figure 6 AGC recordings of signal plus noise
Summary and Conclusions
The objective of this paper is to present the effect of interference noise on actual real-time monitored downlink signal status, and measure the AGC characteristics of image signal based on the data. Three general conclusions can be reached:
- this effect occurs under receiving antenna on low elevation
angle.
- this effect occurs in the same orbit and same direction. It is
highly to be relate to effect of external noise.
- to change the physical characteristic of JERS-1 satellite image data by interference noise.
- Yukio Haruyama, "Japanese ERS-1 to Ground Station Interface
Description," Earth Observation Program Office NASDA Headquarters,
1991
- Shunji Murai, "Remote Sensing Note," Japan Association on Remote
Sensing, 1992.
- Warren L. Flock, "Electromagnetics and The Environment : Remote
Sensing and Telecommunication," University of Colordo, Boulder,
Colorado., 1979.
- Takehiro Iida, "JERS-1 Data users handbook," Earth Observation
Center National Space Development Agency of Japan., 1992.
- Kenneth Brayer, "Data Communications via Fading Channels," IEEE
PRESS, 1975
- Bell Telephone Laboratories, Transmission System for Communications,
Winston-Salen, NC, Western Electric: 1964.
- GTE Lenkurt, "Engineering Considerations for Microwave
Communications Systems," San Carlos, CA : GTE Lenkurt, Inc.,
1972.