| GISdevelopment.net ---> AARS ---> ACRS 1997 ---> Mapping from Space |
DTM Accuracy derived from
interferometry SAR
Mitsuharu
Tokunaga
University of Tokyo, Institute of Industrial Science
7-22-1, Roppongi, Minatoku, Tokyo 106, Japan
E-mail: toku@shunji.iis.u-toky.ac.jp
University of Tokyo, Institute of Industrial Science
7-22-1, Roppongi, Minatoku, Tokyo 106, Japan
E-mail: toku@shunji.iis.u-toky.ac.jp
Abstract
The program for Digital Terrain Model (DTM) generating using SAR interferometry derived from JERS 1 was developed. The DTM were calculated using SAR Interferometery data of JERS-1 by the developed program. The accuracy of the calculated DTM is that maximum error and R,M,S,E were 217 m, and 27.7 m respectively. The accuracy aren't better than theoretical values, but it is regarded as the next factor. (1) positions and orientations of the satellite (2) precision of geometric correction (3) phase unwrapping algorithm. In this study, the DTM accuracy derived from Interferometry SAR made clear.
Introduction
Many articles about Interferometry SAR (InSAR) has recently been published. Because the potentials of InSAR has been provided in many fields, as DTM generation, glacier analysis, the earth crust change. Especially, it is provided the high accuracy couldn't be provided in usually remote sensing data in the field for DTM change.
However, the majority report is just calculated the fringe data the report the is evaluated the DTM is few.
In this study, the comparison DTM derived from interferometry SAR with DTM made from topographic map was carried out.
Fundamental of DTM Generation by Interferometry SAR
The Figure 1 shows the geometry of Interferometry SAR.
Fig. 1 Geometry of Interferometry SAR
Where :
B : Baseline between two SAR antenna.
a : inclination angle of baseline
q : incident angle of radar
R1,R2: the length of slant range
H : the height of Satellite 1 from surface of the earth
h : the elevation value of target point
The difference of the slant length of SAR 1 and SAR 2 is approximated the next equation.
R2-R1 = Bsin(q - a) (1)
Also, the relation of difference of phase and elevation value shows the nest equation
f = 4pBsin(q-a)/l (2)
Then, the elevation values are calculated by the following equation according to the geometry of interferometry.
h = H-R1cosq (3)
If phase difference f is already known, q can be calculated by the equation 2. So, the elevation values are calculated according to the equation 3. But, it is difficult that the height of the satellite is determined precisely. Now, the next equation shows the partial differential equation of different phase against slant range and elevation.
The equation 4 shows the proportion of different phase against the change of the slant range. So, it is shown the fringe when the surface of the earth is flat. That is why it is called the orbit fringe.
The equation 5 shows the relation of phase difference and elevation. The elevation value is calculated from the difference of phase difference from the orbital fringe.
Process
The DTM were provided according to the next flow
- Geometric Corresponding
Geometric correction were carried out for corresponding to two SAR images.
In this paper, corresponding points were selected better points into some candidate corresponding point by manual.
- Calculation of the phase difference
Subtracted the phase of SAR 1 from one of SAR 2
- Calculation of the orbital fringe
The orbital fringe created according the equation4.
- Extraction the orbital fringe
Subtracted the phase difference generated in (2) from the orbital fringe. If the elevation fringe is not appeared, regenerated the orbital fringe by changing the orbital position parameters. Because the orbital position data aren't precise for interferometry processing.
- Phase unwrapping
The phase are distributed 0 to 2p. Therefore, the phase must be integrated. However, it is difficult to process by influence of the noise. Some method were proposed, but the best one is unknown.
- Conversion phase to DTM
Convert from the integrated phase to elevation value according to the equation 5.
The following images are processed as input data.
- JERS 1 Level 0, 1993/07/07 (Fig.3)
- JERS 1 Level 0, 1993/08/20 (Fig. 4)
Fig. 3. JERS1 SAR images (Mt. Fuji)
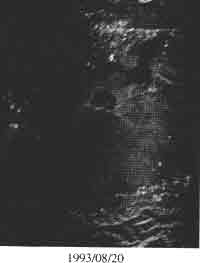
Fig. 4 JERS1 SAR images (Mt. Fuji)
The reference DTM data is used the 50m grid digital map data made by Geographical Survey Institute of Japan.
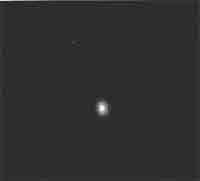
Fig. 5 DTM from topographical map
Fig. 6 shows the estimated line. Estimated the DTM on the estimated line. Fig. 9 and Fig 10, are ploted the DTM on the estimated line.
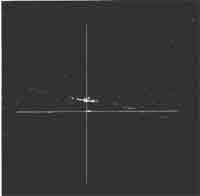
Fig. 6. Plot line for DTM estimation
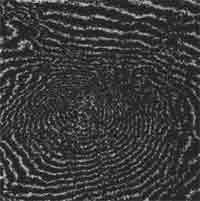
Fig. 7. Fringe
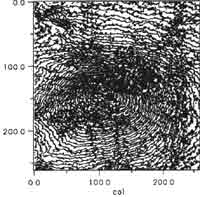
Fig. 8. Contour Line of Generated DTM
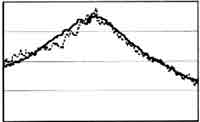
Fig. 9. DTM Profile for Azimuth direction (Real Line: Topograph, Break line: generated DTM)
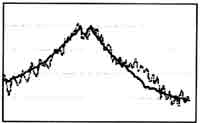
Fig. 10. DTM Profile for Range direction (Real Line: Topograph, Break Line generated DTM)
Conclusion
The accuracy of DTM derived from SAR interferometry using JERS-1 were made clear in this study. Even if the accuracy of the satellite positions and orientations, the length of baseline, the change of surface of the earth (corresponded with correlation coefficient) and the algorithm of phase unwrapping gave influence to precision of the DTM generation, their quantitative relations couldn't make clear in this time.
In the future, some experience will be examine on the difference condition, as different length of base line, the different observation data, and so on.
Finally, the factor obstructing promotion of studies on SAR interferometry recognized through this study are described.
The most important factors is that whether ability to generate SAR interferogram isn't understood till two SAR data are handled. The fact means it isn't understood whether process of SAR interferometry is well before having purchased SAR data.
Additionally, there is observation interval for more than 44 days at least in the case of using JERS1 data. Naturally, the surface of the earth may be changed in the meantime. So the fact is indicated that it is difficult to process the interferometry SAR data by repeat pass observation.
So, it is same situation about the length of baseline. The length of baseline could just calculate after having purchased SAR data.
Therefore the catalogue search system is required for interferometry SAR data. It is advisable to be able to display the length of baseline, incident angle and correlation coefficient at least as search items in the system.
Finally, SAR data set consisted complex type are distributed is expected in order to study SAR interferometry.
Reference
- NASDA : JERS-1 Science Program Application Data Sets, JERS-1/SAR
Interferometry, CD-ROM Vol. 1, 1995
- Richard M. Goldstein, Howard A. Zebker, Charles L. Werner: Satellite
radar interferometry : two-dimensional phase unwrapping, Radio Science,
Vol. 23, No. 4, pp. 713-720, Jul.-Aug., 1988
- J. M. Huntley, H. Saldner: Temporal phase-unwrapping algorithm for
automated interferogram analysis, APPLIED OPTICS, Vol. 32, No. 17, Jun.,
1993
- Howard A. Zebker, Richard M. Goldstein : Topographic Mapping From
Interferometric Synthetic Aperture Radar Observations, Journal of
GEOPHYSICAL RESEARCH, Vol. 91, NO. B5, pp. 4993-4999, Apr., 1986
- A. K. Gabriel, R. M. Goldstein, H. A. Zebker : Mapping small
elevation changes over large areas : Differential radar interferometry,
J. of Geophysical Research, Vol. 94, No. B7, pp. 9183-9191, 1989
- Claudio Prati, Fabio Rocca, Andrea Monti Guarnieri, Elvio Damonti :
Seismic Migration For SAR Focusing :
Interferometrical Applications, IEEE Trans. GE, Vol. 28, No. 4, pp. 627-639, Jul., 1990
- Howard A. Zebker, Soren N. Madsen, Jan Martin, Kevin B. Wheeler,
Timothy Miller, Yunling Lou, Giovanni Alberti, Sergio Verella,
Alessandruo Cucci : The TOPSAR Interferometric Radar Topographic Mapping
Instrument, IEEE Trans. GE, Vol. 30, No. 5, Sep., 1992