| GISdevelopment.net ---> AARS ---> ACRS 1997 ---> Mapping from Space |
Lahar Hazards Monitoring on
the Eastern Side or
Mt. Pinatubo Using
Multi-Temporal JERS-1 SAR
Salvador, J. H.
G.1, Kambara, H.2, Obara, K.2, Matano,
Y.2, Hato, M.3, Almeda, R.1 and Lacadin,
N.4
1Mines and Geosciences Bureau, Central Office, Philippines
(Fax : 632-928-8544)
2 Nikko Exploration and Development, Co., Ltd., Japan
(Fax : 81-3-3508-9785
3 Earth Remote Sensing Data Analysis Center, Japan
(Fax : 81-3-3533-9383)
4 Mines and Geosciences Bureau, Regional Office No. 3,
1Mines and Geosciences Bureau, Central Office, Philippines
(Fax : 632-928-8544)
2 Nikko Exploration and Development, Co., Ltd., Japan
(Fax : 81-3-3508-9785
3 Earth Remote Sensing Data Analysis Center, Japan
(Fax : 81-3-3533-9383)
4 Mines and Geosciences Bureau, Regional Office No. 3,
Abstract
Multi-temporal JERS-1 SAR image were taken over Mt. Pinatubo in Central Luzon, Philippines to continue the lahar hazards monitoring. The 06 May 1993, 25 February 1995 and 20 August 1995 SAR images were overlaid and assigned in the blue, green and red color assignments, respectively.
The SAR images clearly show the lahar distribution over the eastern side of Mt. Pinatubo. The images show that most of the 1995 lahars was channel-confined. Some areas near the Sacobia-Bamban River have "stabilized" or out of the way of the 1994 and 1995 lahars allowing vegetation to regrow. The feature observed were verified in the field.
Introduction
This project was carried out as part of the three-year Philippines-Japan cooperative undertaking by the Philippine Mines and Geosciences Bureau (MGB) under the Department of Environment and Natural Resources (DENR), Nikko Exploration and Development Co., Ltd . (NED) nd Earth Remote Sensing Data Analysis Center (ERSDAC), Japan. The main objective is to apply remote sensing technology to the management of the coastal environment and resources in Luzon Island.
The violent eruption of Mt. Pitantubo in June 1991 caused a major environmental problem in Central Luzon. The eruption killed several lives and destroyed infrastructure, forest and agricultural lands. The estimated total damages in 1991 amounted to Php 8.972 billion (DPWH, 1991). A secondary disaster caused by lahar flows continues to pose a problem to both life and property. Lahar events and deposition block drainage systems, made new routes for rivers and cause flooding during the rainy season further aggravating the situation.
The Study Area
The study area is located in Luzon island, bounded by latitudes 15°00'N to 15°30'N and longitudes 120°20'E to 121°00'E (Fig.1). It covers the provinces of Tarlac, Zambales, Pampanga and Nueva Ecija. The prominent urban centers within the study area include Angeles City, site of the Clark Air Base now the Clark Special Economic Zone, San Fernando and Tarlac, Tarlac, which hosts the Luisita Industrial Complex.
There are eight main drainage systems around Mt. Pinatubo (Fig. 1). These are the Pasig-Potrero, Abacan, Porac-Gummain, Sacobia-Bamban, O'Donnel, Sto. Tomas, Bucao and Maloma. The first four from part of the Pampanga River drainage system. Of these, two test sites were selected, namely, the Sacobia-Bamban and Pasig-Potrero River drainage systems.
Climate
Central Luzon has a type I climate. The dry season generally starts from November and continues to April. The rainy season begins in May and ends in October. The annual average temperature is 27°C. The total annual rainfall at Clark Air Base, Pampanga is 2,011.0 mm and 1,910.6 mm at Hacienda Luisita, Tarlac (Martinez and Lacadin, 1992). The rainy season is usually accompanied by typhoons and monsoons.
Topographic and Geologic Setting
The study area lies on the western portion of the Central Luzon Basin, an elongate, north-south trending through extending northwards to the Lingayen Gulf and southwards to Manila Bay. The basin is bounded on the east by the Sierra Madre Mountain Range, on the northeast by the Central Cordillera and on the west by the Zambales Mountains. Uplift of the range bounding the Central Luzon Basin and the movements along the northwest trending left-latest Philippine Fault influenced the basin's structure. The basin, ranging in age from Late Eocene to Pieistocene is filled with about 9,000 meters of sediment (Javelosa, 1994).
There are more than 200 volcanoes in Philippines. Of these, 21 volcanoes are considered active. Mt. Pinatubo and Taal volcano belongs to the West Luzon active volcanic belt. This belt is related to the eastward subduction of the South China Sea Plate in the Manila trench located west of Luzon island. Mt. Pinatubo is located approximately 90 km northwest of Manila. It is an andesite-decite stratovolcano and is the higher peak in the Pinatubo-Mariveles Volcanic Belt (Umbal, 1995).
Methodology
Three JERS-1 SAR L-band images over Central Luzon were studied to assess its effectiveness and adaptability in monitoring the lahar distribution and its trend to help mitigate the lahar hazard on the eastern side of Mt. Pinatubo. SAR has the capability to penetrate through cloud cover to obtain the data on the ground. It can therefore be used to monitor the dynamic changes in the lahar distribution during the rainy or dry seasons.
Four scenes of JERS-1 SAR acquired in May 1993, were digitally mosaicked to show the entire volcanic eruption area (Fig. 2). Pre-processing included geometric corrections of the images. The root mean square error in the JERS-1 SAR after correction was below three pixels. The correction of layover by the altitude was not done.
The images were acquired in 06 May 1993, 25 February 1995 and 20 August 1995. Ground control points (GCPs) were taken from the 1:50,000 scale topographic map. The GCPs were selected mainly from prominent features along the floodplain so that the elevations are relatively the same. The root mean square error was below three pixels. The correction of layover by the altitude was not applied.
The correctly image were then enhanced, filtered and overlaid top each other.The 1993, February 1995 and August 1995 images were assigned to the blue, green and red colour assignments respectively. They were printed as a single image for visual interpretation (Fig. 3).
The resulting colors in the multi-temporal image highlight area that has changed or did not change over time. Generally, surfaces that did not change much appear black or white. Surfaces that changed appear in shades of blue, green, yellow, red and cyan. Caution is given the flat surface like airfield in Clark and water bodies exhibit black tones even if some change occurred in them. In late 1996, a fieldwork was conducted in Central Luzon to verify the features observed on the multi-temporal JERS-1 SAR images.
Results of Photointerpretation and Field Verification of the Lahar Disaster Area
In fig. 1 and 3, the lahar sediments appear in dark tones. Generally, the dominant size range of the lahar sediments was measured in the field to be in the 10mm to 40m diameter range. The surface of these sediments appears to be flat and smooth surface in L-band range, thus it has a low backscatter. This is in sharp contrast to the surrounding vegetated areas that exhibit high backscatter. Being so, new lahar deposits are easy to distinguish in the JERS-1 SAR image and their distribution is clearly observed. Sediment size with respect to the L-band is an important factor in the easy identification of the lahar deposits.
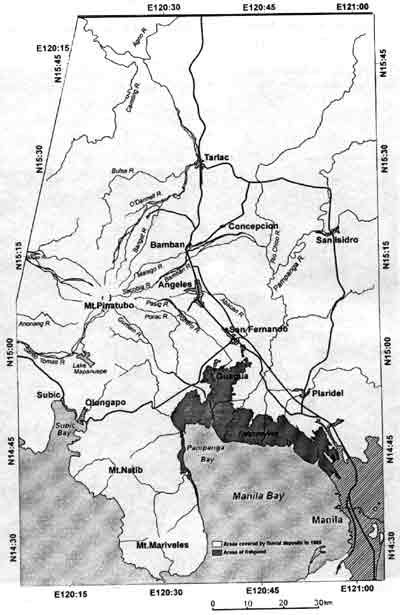
Fig. 1 - Drainage System around Mt. Pinatubo
In the Pasig-Potrero River System, the dark tones have overflowed from the former drainage pattern (compare with Fig. 3) but appear to be mostly confined within the megadike structure. This indicates that most lahars were channel-confined in 1995 except for some areas on the northern edge of the dike (bluish tone). There are experienced flooding in 1995. The same is true for the lahars in the Sacobia-Bamban River System.
However, the upper parts of the Pasig-Potrero River, a yellowish tone was observed. This was interpreted to mean that in 1995, these yellowish area were not affected by lahar flows. The same is true with the yellowish areas on the northern edge of the Sacobia-Bamban River. At this location, "talahib" grass have already grown over the lahar deposit. This implies that these yellowish toned areas have stabilized.
At the middle part of the Sacobia-Bamban River, lahar blocked a small river to form a lahar-dammed lake. This shown in block color.
Conclusion
JERS-1 SAR images can easily identify the distribution of lahar deposits. They show up as dark tones. This is mainly due to the marked difference in the size range of the lahar sediments and the L-band SAR.
Much of the 1995 lahars were channel-confined within the megadike system, except of some that broke through and caused flooding. Some areas in Sacobia-Bamban have stabilized. They were not affected by the 1995 lahar flows. Vegetation were observed already growing on the lahar deposits. These features are also clearly seen in the multi-temporal JERS-1 SAR images.
References
- Javelosa, R. S., 1994, Active Quaternary Environmentals in the
Philippine Mobile Belt. International Institute for Aerospace Survey and
Earth Sciences, ITC Publication, n. 20. 179p.
- Martinez and Lacadin, N. B. 1992, Notes on the role of abandoned
stream channels and irrigation canals as sediment delivery systems in
lahar prone areas of Tarlac Province.
- Umbal, J. V., 1995, Mount Pinatubo and lahar affected river systems, Eighth Regional Conference on Geology, Minerals and Energy Resources of Southeast Asia. Guidebook of Fieldtrips, GEOSEA '95.
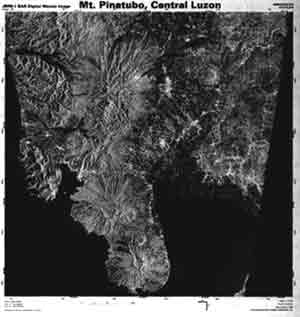
Fig. 2 - JERS-1 SAR Digital Mosaic image of Mt. Pinatubo Lahar-affected Area
(Data Acquisition : 93 May 06-07).
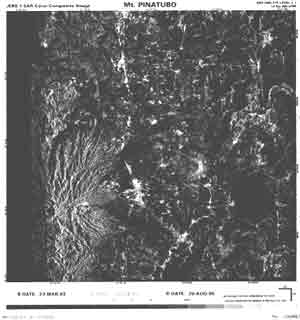
Fig. 3 - JERS-1 SAR False Color Composite Image (BGR = 93/May, 95/Feb, and 95/Aug).