| GISdevelopment.net ---> AARS ---> ACRS 1997 ---> Mapping from Space |
Complementary Nature of SAR
and Optical Data for Land Cover/Use Mapping in the State of Johore,
Malaysia
Z. A. Hasan, K. M. N. Ku
Ramil, I. Selamat and K. F. Loh
Malaysian Centre for Remote Sensing (MACRES)
5th Floor, City Square Centre, Jalan Tun Razak, 50400 Kuala Lumpur
Lot CB 100, 5th Floor, City Square Centre,
Jalan Tun Razak, 50400 Kuala Lumpur, Malaysia
Fax: 603-2645650, Tel: 603-2635640
E-mail: IPA@MACRES.GOV.MY
AbstractMalaysian Centre for Remote Sensing (MACRES)
5th Floor, City Square Centre, Jalan Tun Razak, 50400 Kuala Lumpur
Lot CB 100, 5th Floor, City Square Centre,
Jalan Tun Razak, 50400 Kuala Lumpur, Malaysia
Fax: 603-2645650, Tel: 603-2635640
E-mail: IPA@MACRES.GOV.MY
Under the EC-ASEAN ERS-1 Programme, MACRES has undertaken a pilot project to assess the complementarity of Landsat TM and ERS-1 data for land cover/use mapping in the state of Lahore, Malaysia. Three conclusions were arrived at. These where-ERS-1 data by themselves are of limited use for land cover mapping due to insignificant difference (less than 2.0 decibels) in backscatter returns of the major cover types found in the study area. The HIS composite of TM 453 with the ERS-1 substituting for the intensity gives the best differentiation of cover types visually, and ERS-1 temporal data has potential for effective land cover change detection, making it a useful tool for updating existing land use/cover digital data derived from optical remote sensing.
Results substantiating the above conclusions are highlighted in the paper. Of particular interest are the temporal backscatter signatures obtained from the cover types in the study area.
Introduction
Optical data such as SPOT and Landsat TM, complementing aerial photography are presently used for land use/cover mapping in Malaysia by the Department of Agriculture (DOA). Apart from the advantages of using these data, there are two major problems encountered: -(i) The availability of cloud free data for regular updating particularly in Johor and (ii) The difficulty to differentiate some land use/cover types such as rubber and oil palm which are having almost similar spectral response (Loh, et. al, 1995; Brown. Et. al, 1995). SAR data with the capability to penetrate through the clouds becomes more important especially in those areas with persistent cloud covers. However, the understanding and processing of SAR data is still at its infancy stage and this will limit the use of SAR data in Malaysia for the time being.
A pilot project entitled "Complementary Nature of SAR and Optical Data for Land Use/Cover Mapping in Johor (MAL-1) was implemented during 1993-96 under the auspices of EC-ASIAN collaboration. The main aim of the project was to effect the transfer of technology on the use SAR data from the EC to ASIAN nationals to meet developmental and environmental needs. The Objectives of this paper were:
- To develop a methodology for complementary use of ERS-I SAR and
optical data for land use/ cover mapping
- To analyse the complementarity of ERS-1 and optical data for land
cover change detection.
- Description of Study Area
Johor State was selected because the experiences extensive cloud covers problem throughout the year and flat terrain of most the area except at the Gunung. However due to limited availability and late delivery of ERS-I data, the project tem could only focused on areas covered in topographic map sheets 124, 125, 129 and 130 series L 7010 at the scale of 1: 63 360 as shown in Figure 1. However, full processing of SAR data was done only on map sheet 130. The land use/cover of Johor are predominantly plantation crops such as oil palm, rubber, coconut, forest and pineapples. Most of the vegetation is therefore perennial with little seasonal change.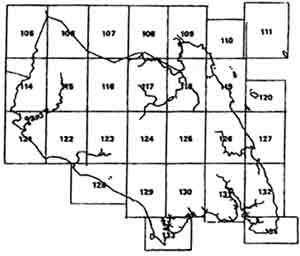
Figure 1: Location of Study Area
- Materials
ERS-I SAR Imagery
PRI images were used for the study PRI images were considered as second level data where the basic corrections - the reduction of speckles using multi-lock images and slant to ground range conversion have already been performed by the ground station. A total of 16 frames were delivered to MACRES out of which 8 images (Table 1), covered over the same area and used in further processing of ERS-I data
Table 1 : ERS-I SAR data used for the processing Orbit/Frame Date Phase Processing Station 10512/3573 20.07.93 C German 10714/3573 05.08.93 C German 11013/3573 24.08.93 C German 12244/3573 18.11.93 C German 12917/3573 04.01.94 D Thailand 13218/3573 25.01.94 D Thailand 13519/3573 15.02.94 D Thailand 13562/3573 18.02.94 D Thailand
Notes:Phase C- First Ice Phase - Apr. 1992 to Dec. 1992
Phase D- Multi-disciplinary Phase- Dec. 1993 to Mar. 1994
Landsat TM Imagery
Three imageries were available for the project;
Path/Row Date of Acquisition 125/59 11.03.1991 125/59 26.06.1995 126/59 22.06.1995
The images were printed at the scale of 1:250000 for the full scene and also 1:50000 for smaller area corresponding to topographic map sheet size.
Ancillary Data
The ancillary data used for the study were topographic maps, landuse maps and field survey data. Topographic maps at the scale of 1:63 360 were used as a reference for fieldwork and preliminary abstraction of landuse/cover information for the area. Landuse maps prepared by DOA were used for the fieldwork. For better discrimination of crop boundary the digital landuse vectors were overlaid on the images.
Several field works were conducted at the site selected based on the availability of the data. Images of ERS-1 SAR data, Landsat TM and combination of both were used for tile fieldwork.
- Methods
Data Processing
The processing was carried out using Meridian, Ergo-Vista and MICSIS software available at MACRES.
Compression
The 16 bit ERS-I data were compressed to 8 bit data due to the limitation of Meridian software in processing 16 bit data. The higher digital numbers correspond to urban areas and corner reflectors. However the region of interest, vegetative covers have DN's ranging from 0 to 1500. These values were maintained during vegetation cover a wide dynamic range in DN values.
Geo-Referencing
The Landsat TM imagery scene 125/59 dated 1 1.03.91 was geometrically rectified to conform to the Malaysian map projection using 20 control points digitized from topographic maps at the scale of 1:63360. The geocoded images was then resampled to 12.5 pixel to correspond to the pixel size of ERS-I SAR data. Then all the SAR data were rectified using images to image registration techniques with the geocoded Landsat TM data as the reference image.
Filtering
Speckles of noise were resulted from the coherent nature of radar waves. The presence of speckles in the image reduces the ability of the user to interpret the images. Several filters were evaluated. These included few common filters such as mean, median, average, low pass and high pass filters. However, these filters were not suitable for SAR data. Attention was given to the special SAR filters such as Lee, I Frost, Map and Map Refined developed in Ergo-Vista software. The analysis was based only on visual interpretation not al all based on Stastical approach.
Visual Analysis
Six panchromatic ERS-I images, four multi-dates ERS-I, SAR, two images from combination of Landsat TM and ERS-I and two images from Intensity, hue and saturation transformation were produced for visual interpretation. The analysis was made by comparing, the images generated with existing land cover map cover and ground survey data.
- Filters
Generally the filter kernel size of (7 x7) and smaller gave better visualization compared to bigger filter kernel sizes. The blurring increased as the size of the filter kernel increases.
Lee filter was found to be effective in smoothing homogeneous areas and at the same time blurring fine features. Frost filter was effective in retaining fine details and edges but slightly lower performance in homogeneous areas. Mp filters showed better results than the other two filters especially its ability to enhance linear features, field boundaries land also smoothing in homogeneous areas.
- Visual Analysis
Single Data SAR Data
Six panchromatic images were produced for interpretation. Single data images did not provide good discrimination among features on the ground and therefore are not useful for visual analysis. The image 10512/3573 dated 20.7.93 was found to be brighter than the other five images. This was due to the strong wind that caused the ruffle on the water resulting in a strong return to the sensor and hence the image appeared brighter. This is clear indication of the sensitivity of SAR data to surface roughness.
Multi-dates SAR Data
Four colour composites have been generated for multi-dates ERS-I SAR. These composites improved the visual interpretability of land cover features compared to the single data SAR data. With the correct choice of dates for combination, the information extraction could be maximized.
ERS-1/Landsat TM Combination
Two combinations were generated Two SAR data with one. TM data and two TM data with one SAR data. The information on the images was dominated by Landsat TM data especially band 4 which was an infrared band and very sensitive to vegetation cover. Contribution from SAR data was more conspicuous in hilly areas where the effects from relief were accentuated.
HIS Transformation
The national of this transformation was to replace the intensity image, which was the least sensitive to the human eyes compared to Hue and Saturation, with ERS-I SAR data. Bands 3, 4 and 5 of Landsat TM data were converted to HIS and the Intensity i e replaced wit one selected SAR data and reconverted to RGB. As a result, an image with better delineation of crop boundary was generated.
Oil Palm
Oil palms when mature is generally distinguishable by a high backscatter and there fore appear as bright colours on multi-temporal images. It also tends to be uniformed in brightness with little variation between dates. Young oil palm up to three years from planting is more variable due to changes in ground cover and soil conditions and can be confused with rubber and forest. The backscatter of young oil palm was less than that of mature oil palm. Therefore it looks darker compared to colour of mature oil palm (Brown. Et. al, 1995).
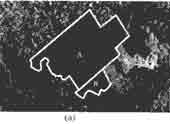
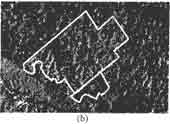
Figure 2 : Different ages of oil palm as seen on Landsat TM dated 1991 (a) and ERS-1 SAR data dated 4 Jan. 1994, 25 Jan. 1994 and 18 Feb. 1994 (b).
A: Oil palm planted in 1968
B: Oil palm approximately 30 years old in 1991 and replanted before 1994
 Figure
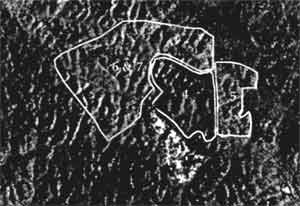
3: Different ages of oil palm on ERS-1 SAR data
Figure
3: Different ages of oil palm on ERS-1 SAR dataERS-1 SAR image, Lee filtered 3x3
Red : 4 January 1994
Green : 25 January 1994
Blue : 18 February 1994
Phase 5, 6, 7 :planted 1964
Phase 4 : planted 1993
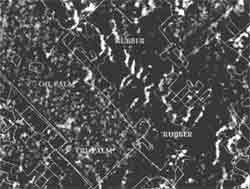
Figure 4: Rubber and palm on multi-temporal ERS-1 SAR data, Lee filtered 3 x 3.
with 1990 land cover map
Red : 4 January 1994
Green : 25 January 1994
Blue : 18 February 1994
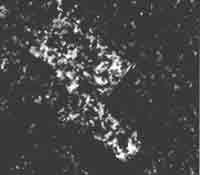
Figure 5: Banana plantation on ERS-1 SRS image
Red and Green : 24 Aug. 1993
Blue : 20 Jul. 1993
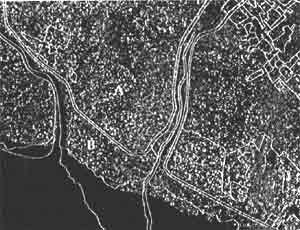
Figure 6: HIS image with 1990 land cover map Intensity from ERS-1 SAR data-20 Jul
1993 . Hue and saturation from Landsat TM data bands 3, 4, 5-
22 Feb. 1994
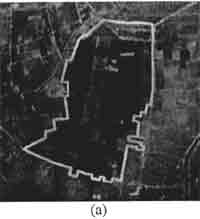
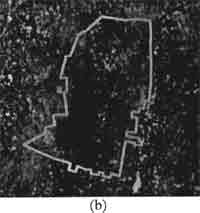
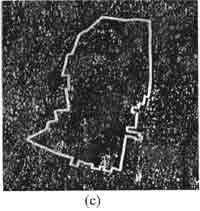
Figure 7: Pineapples as seen on Landsat TM (a), ERS-1 SAR (b) and HIS images (c)
Multi-temporal ERS images by themselves are of a limited value for land cover classification of perennials because of small differences in their backscattering and temporal stability (or lack of seasonal change)
ERS SAR is capable of discriminating major land cover type such as oil palm and rubber. With the exception of bananas the discrimination is not better than optical imagery. Bananas show very clearly on SAR due to the very high backscatter.
There is little advantage in combining ERS SAR with optical imagery for land cover classification. There may be marginal improvement in discriminating between land cover types and they are not generally for dates close enough to exclude the possibility of changes having occurred between the dates of the two sources.
The best way of the two data types to complement each other would seem to use optical imagery when available for baseline mapping, and to use multi-temporal ERS SAR for change detection and map updating. This seems particularly relevant for changes in large plantation and in forest cover.
An approach that has been tried in the UK (Slater, Brown and Wooding, 1995) is to create a multi temporal composites with image from different years rather than from different months. With seasonal changes being for minor importance, a three-year composite would effectively detect changes over a throe-year period over large areas for relatively low cost.
References
- Brown, R. E., Wooding, M. G., Batts, A. J., Loh, K. F., Ku Mohd Noh
Ku Ramli, Nordin, L., (1995) Complementary Use of ERS SAR and Optical
Data for Land Cover Mapping in Johore, Malaysia. Paper presented at ERS
Application Workshop, London, and September 6-8, 1995.
- ESA Publications, (1992) ERS-I Systems,ESA SP-1146
- Loh K. F., Ku Mohd Noh Ku Ramli and Nordin. L., (1995).
Complementary Nature of SAR and Optical Data for Land Cover Mapping,
Paper Presented at the Conf. On Remote Sensing and GIS for Environmental
Resources Management, Jakarta, Indonesia, June 6-8, 1995
- LOH, K. F., I. Selamat, Z. A. Hasan, Ku Mohd Noh Ku Ramli, S. Ahmad
(1996) Updating of Land Cover Maps Using SAR Data, Paper presented at
the 9th ASIAN Remote Sensing Experts Group Meeting, Jakarta, July 22-34,
1996
- Slater J., Brown R. E, and Wooding, M. G. The use of ERS- I SAR for
Monitoring of Environmentally Sensitive Areas in England, Processing's
of the Second ERS Publications Workshops, London, 6-8 December 1995. ESA
Publications.