| GISdevelopment.net ---> AARS ---> ACRS 1997 ---> Land Use |
Analysis of Tasseled Cap
Transformation Features in Winter Land Cover Using Fuyo-1 OPS Data
Choen Kim
Kookmin University
Dept. of Forest Resources
Seoul 136-702, Korea
Tel.: +82-2-910-4813, Fax: +82-2-910-4813
E-mail:choenkim@kmu.kookmin.ac.kr
Abstract Kookmin University
Dept. of Forest Resources
Seoul 136-702, Korea
Tel.: +82-2-910-4813, Fax: +82-2-910-4813
E-mail:choenkim@kmu.kookmin.ac.kr
High solar zinith angles cause strong topographic illumination effects in the temperate mountain forest. The effect. The effects complicate and obstruct the operational application of optical remotely sensed data. This paper shows how the effects of differential shading on the Fuyo-1 OPS Classification image could be suppressed through differential shading on the Fuyo-1-OPS Classification image could be suppressed through the use of tasseled cap transforms instead of the original spectral bands. The obtained brightness and greenness transforms in the 8 class-base soil shaded forest, river conifer (sun-exposed), hardwood (sun-exposed), urban, winter fallow land-provide useful information on winter land cover in northern mid latitude. This paper proved the accuracy of the SAM classification compared to the maximum likelihood performance by the using brightness, greenness, and wetness values, and also examined the good relationship between greenness variables and forest stand volume.
Introduction
Winter cover classification from optical satellite date needs further correction for topographic effects originating from the high solar zenith angles. This is because, at a low sun elevation in mid and/or high latitude rugged terrain the geometric reflectance models and ratio algorithms have been proven unsatisfactory for correcting variation of illumination due to the confounded shadowing of the terrain and forest canopy on the multispectral data (Durrieu, 1995; Peddle et al., 1995; Ekstrand, 1994). Besides spectral data, the in corporation of ancillary data and fuzzy logic have recently been used for improving the classification accuracy by 10-30% compared with conventional classification techniques (Carpenter et al., 1997; Jensen, 1996; Maselli et al., 1995). These techniques are applied only to the specific information extraction within a mixed pixel and require a more complex hierarchical process than conventional supervised classification techniques (Jensen, 19960, although neural network classifiers employ automatic classification from both spectral and spatial on texts and can be used to deal with spatial data at different measurement scales (Gong, 1996). Because of the factor variability induced by topographic effects, it is difficult to differentiate the forestcover types on winter satellite imagery. These considerations led to the initiation of a research project to examine if the effects of shadow on the final classification image could be eliminated and/or diminished using two classification techniques, i.e., the spectral angle ampper (SAM) and the tasseled cap transformation. These pixel-by-pixel techniques should allow classifying the winter forestcover type on the sun-exposed aspects of Fuyo-1 OPS imagery. The objectives of this paper are 1o 1) assess the accuracy of the SAM classification in comparison with the maximum likelihood method using brightness, greenness and wetness values derived from the tasseled cap transformation of Fuyo-1 OPS daa, 2) analyze the differences between the brightness and greenness variations influenced by topographic effects, and 3) to test relating the tasseled cap variable combinations to forest stand parameters, e.g., stem volume and canopy structure, considering topographic effects in the winter temperate mountainous forest.
Study Area and Data
This area is mainly divided into the steep mountains portion, the delta plain portion, and the river portion. For the performance of standwise forestcover classification, the study area was selected, which includes complex forested terrain in the Nakdong River basin. It is situated in the center of the area 35° 14' 05" North latitude, 128° 53' 49" East longitude. The area (1500 x 800 Fuyo-1 OPS pixels) is approximately sieb. Et Zucc.) stand, which have largely been affected by human activities, are dominant in this temperate forest region. Fuyo-1 OPS data with a spatial resolution of 18.3 x 24.2m are not applicable to the observation of an individual tree. Therefore, ground truth data are subject to the synoptic scale of satellite sensors. According to this limitation, the forest cover maps at a scale of 1:25000 produced by the Forestry Research Institute of Korea were used for extracting the parametric information based on forest stand. The volume table used also in this tudy was able to calculate the stand volume, namely, volume per hectate, in combination with field inventories, which were collected during December 1994.
The Japanese Earth Resource Satellite-1(JERS-1, now renamed Fuyo-1) Optical Sensor (OPS) data for the area were obtained at 11:23 AM on 26 December 1992, with a solar elevation of 28.9° and a sun 160.8°. The north facing slope regions of the image is obviously shadowed by the direct solar radiation due to the low solar incidence angle. The OPS system equipped with linear CCD arrays with 4096 elements consists of two subsystems, i.e., a visible and near-infrared radiometer (VNIR) and a short wavelength infrared radiometer (SWIR). The VNIR has three spectral bands for nadir viewing (0PS 1:0.52 to 0.60 mm, OPS 2:0.63 to 0.69mm and OPS 3:0.76 to 0.86 mm) and the near-infrared ban dfor forward viewing (15.33o from nadir, OPS4: 0.76 to 0.86 mm). The former OPS 1,2, AND 3 ARE SPECTRALLY SIMILAR TO Landsat TM 2 (0.52 TO 0.60mm), 3(0.63 to 0.69mm), and 4(0.67 to 0.90 mm). The four spectral nadir viewing bands of the SWIR are OPS 5(1.60 to 1.71 mm), OPS 6(2.01 to 2.12 mm), OPS 7(2.13 to 2.25 mm), and OPS 8(2.27 to 2.40mm). The total bandwidths of OPS 6,7, and 8 can spectrally cover TM 7(2.08 to 2.38 mm). The system correction which has been performed by the Remote Sensing Technology Center (RESTEC) of Japan was made up to BSQ Level 2.
In this study, the corrupted SWIR data including brightness saturation due to sensor caused noise problem could be meaningfully restored by applying spatial filtering techniques tested by de Souza Filho et al. (1996).
Classification Techniques
To reduce the variation of illumination with aspect and slope inclination in the image of mountainous forest, the SAM algorithm was employed using the tasseled cap components. Owing to the dependence of greenness on biophysical property of vegetation components must be less sensitive to the problem of variable illumination in the image classification than the original spectral bands, as presented in Carpenter et al. (1997). Here, Meyers (1995) were performed to obtain the components.
In the case of this study, the SAM belongs to a supervised classification technique that determines the spectral signature similarity between the representative spectral mean variables calculated from the training field pixels and the spectral variables derived from each pixel in the image through the spectral angle differences (angular distance in radians and/or steradians) between their vector directions in three dimensional space (see Fig.1)
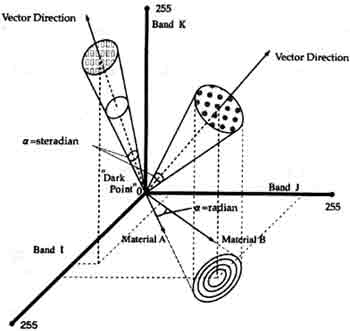
Fig. 1. Diagram of two-and three-dimensional concept of the SAM classification. Darkly shaded pixels should fall near the origin, the dark point.
Results and Discussion
For the study area the extracted component values from the average SWIR band type of OPS tasseled-cap coefficients are shown in table 1 and their multivariate statistics are presented in table 2.
| Brightness | greenness | Wetness | ||
| Average SWIR Band | Mean | 214.097 | -27.683 | -17.256 |
| Std. Dev. | 54.404 | 18.225 | 22.176 | |
| Eig.val. | 3229.885 | 365.044 | 188.830 | |
| Brightness | Greenness | Wetness | |
| Brightness | -0.954 (1.000) |
-0.111 | 2.278 |
| Greenness | 0.169 (-0.505) |
0.567 | 0.806 |
| Wetness | 0.247 (-0.581) |
-0.816 (0.112) |
-0.522 (1.000) |
In comparing the visual discrimination of the tasseled cap transformation images, they are generally connstent with color tone and displayed area for each feature. Therefore, the brightness, greenness and wenters derived only from the confiscation with the average SWIR band were used for each pixel in the classification stage. Table 3 shows the variation of the main value of the brightness and greenness transforms in the 8 classified categories. The highest greenness value is observed in coniferous forests on the sun-exposed aspects, while the brightness values decrease in the order of assets, and shaded forest. Therefore both transforms are related to shadow and canopy closure. The accuracy of the classification results obtained by using the 480 observation samples( a sample size of 2*2 pixel) with 50-pixel rater size, since the categories of the sample are identified above. Here the maximum like hood algorithm could provide the overall classification accuracy better than the SAM algorithm. Within the mountainous area the site-specific misclassified classes ( i.e., river, urban, classification have 5.8658% whereas those by SAM classification contain 7.4374%, with the exception of the unclassified class (Table4).
| Bare Soil | Shaded Forest | River | Conifer (sun- exposed) | Hardwood(Sun- exposed) | Urban | W.arable Farmland | W. Fallow land | |
| B Mean Std. Dev. |
32.82 31.96 |
107.54 13.64 |
106.61 6.82 |
194.48 10.67 |
217.22 24.26 |
218.73 20.01 |
251.56 14.60 |
318.95 17.49 |
| G Mean Std. dev. |
-62.25 9.04 |
-32.62 3.57 |
-52.97 2.46 |
10.97 6.51 |
-23.55 6.58 |
-59.45 5.82 |
32.34 20.82 |
-40.70 4.01 |
| Class label | SAM(%) | Maximum Likelihood(%) | Observation |
| Unclassified | 2.2666 | ||
| Bare soil | 14.8928 | 1.0423 | 5.2789 |
| Shaded forest | 2.4199 | 7.8059 | 10.5578 |
| River(water) | 0.3163 | 0.0038 | |
| Conifer(Sun-exposed) | 9.5366 | 15.1611 | 16.0397 |
| Hardwood(Sun-exposed) | 12.7838 | 19.4622 | 17.4609 |
| Urban(Housing) | 2.6969 | 0.4041 | |
| Winter arable farmland | 0.449 | 5.5107 | |
| Winter fallow land | 3.9754 | 0.3072 | |
| Total | 49.3373 | 49.3373 | 49.3373 |
The unclassified pixel, however are mainly observed on the north facing slopes, i.e., the shaded forest in the mountainous ridges. Moreover SAM algorithm can be found by the good delineation of the mixed forest composition and the split canopy structure, although the percentage of the bare soil class (14.8928%) may increase due to decidous trees without leaves in winter. Finally the greenness variables based on the SAM classification results are suitable for estimating stem volume of the coniferous stands (Table5.), whereas those of the hardwood forest are hardly suited predicting forest stand volume. In particular, for the mixed forest stands on the sun- exposed aspects the obtained feature values should be stratified the by the topographic illumination.
| Stem Volume | ||||
| Feature | 18.4 m2/ha | 26.3 m2/ha | 78.8 m2/ha | |
| Brightness | Mean | 161.67 | 176.22 | 168.48 |
| Std.dev. | 6.00 | 2.91 | 4.61 | |
| Greeness | Mean | 9.20 | 15.42 | 17.05 |
| Std.dev. | 4.90 | 3.21 | 3.61 | |
| Wetness | Mean | 11.13 | 10.28 | 12.10 |
| Std.dev | 2.90 | 2.02 | 4.90 | |
Acknowledgments
The National Space Development Agency (NASADA) of Japan provided the Fuyo-1 OPS daa, whose ownership belong to MITI/NSADA, and the Korea Science and Engineering Foundation (DOSEF) provided financial support.
References
- G.A. Carpenter, M.N. Gjaja, S. Gopal and C.E. Woodcock, "ART neural networks for remote sensing : Vegetation classification from Landsat TM and terrain data," IEEE Trans, Geosci. Remote Sensing, vo;. 35, pp. 308-325, March 1997.
- S. Durrieu, "Correction of topographic effects affecting for stands by modeling consequences of variation in roof canopy structure on radiometry for high resolution satellite images, "Proc. of IGARSS'95 symposium, Firenze, pp. 315-319, July 1995.
- S. Ekstand, "Assessment of forest damage with Landsat TM: Correction for varying forest compartment characteristics assessment of forest damage," Remote Sensing of Environment, vol. 47, no. 3 pp. 291-302, March 1994.
- P. Gong, "Integrated analysis of spatial data from multiple sources: Using evidential reasoning and artificial data from multiple sources: Using evidential reasoning and artificial neural network techniques for geological mapping," Photogrammetric Engineering & Remote Sensing, vol. 62, pp. 513-523, May 1996.
- J.R. Jensen, Introductory Digital Image Processing : A remote sensing perspective, 2nd ed. Upper Saddle River, NJ, Prentice Hall. Pp. 240-247, 1996.
- W.A. Malia and T.J. Drury, A.M. Denniss, R.W.T. Carlton and D.A. Rothery, "Restoration of corrupted optical Fuyo-1 (JERS-1) data using frequency domain techniques." Photogrammetric Engineering & Remote Sensing, vol. 62, no. 9, pp. 1037-1047, September 1996.
- F. Maselli, C. Conese, T.D. Filippis and S. Norcini. "IEEE Trans. Geosci. Remote Sensing, vol. 33, pp. 77-83, January 1995.
- D.R. Peddle, F.G. Hall, W. Wanner and E.F. Ledrew, "Remote sensing of photosynthetic activity in boreal forest stands using spectral mixture analysis and geometric-optical reflectance models, "Proc. Intl. Colloquium Photosynthesis and Remote Sensing, Montpellier, France, pp. 159-169, August 1995.
- C.R. de Souza Filho, S.A. Drury, A.M. Denniss, R.W.T. Carlton and D.A. Rothery, "Restoration of corrupted optical Fuyo-1(JERS-1) data using frequency domain techniques," Photogrammetric Engineering & Remote Sensing, vol. 62, no. 9 pp. 1037-1047, September 1996.