| GISdevelopment.net ---> AARS ---> ACRS 1997 ---> Land Use |
Forest Cover and Land
Use/Land Cover Mapping of Mazandran Province, using Remote Sensing
Satellite Tm Data, to Prepare Atlas of Study Area
Majid Ghiassi far, R.S.
specialist, Ali Reza Majd
Head of division
Agricultural Statistic and info. Dept.
(ASID) Ministry of Agriculture Tehran Iran
Abstract Head of division
Agricultural Statistic and info. Dept.
(ASID) Ministry of Agriculture Tehran Iran
Land information is important to a wide variety of human activities such as agriculture, forestry, water resources as well as other type of land resources management.
Landsat thematic mapper ™ data with high resolution particularly the unbroken scope and detailed view (repeated coverage) can be considered in indentification and extent of a variety of land use/landcovers.
The production of various thematic maps together with an up-to-data base map is an proper way to document land use potential. This paper summarizes the results of land use/land cover mapping compiled in the (ASID) Ministry of agriculture.
Main objective of this project is to investigate uniqual characteristics of land units by applying landsat imageries of band 2,3,4 of different dates (190-1) and interpretationof digital data, in addition to the mentioned data crop calendar of related crops was considered as auxiliary data along with collection of ground truth information. The study area cover Mazandaran province with an area of about 45656 square km located in northern part of Iran, to produce land use/land cover maps of the above province, analog and digital interpretation of TM images was taken into consideration and as a general view, the different steps of project could be explained as below.
- defining a comprehensive legend regarding to the scale of TM images
- Geographical modeling and provision of standard sheets
- visual and digital interpretation of TM images.
- Ground checking and necessary improvement of the primary maps.
- Using the auxiliary data and extant maps to promote the information depicted on the land use maps.
- Land unit surface measurement by using GIS facilities. To accomplish the above project the total of 19 TM quadrants have been interpreted and 39 sheets (50x70cm) and 30 by 30 minutes of geographic coordinates) were produced. To make the wide use of such maps possible beside the maps already mentioned. Another collection (1:200,000) named land use atlas were produced in which a brief description on the applied procedure is followed by 1:2000,000 scale land use/land cover maps.
The thematic mapper ™ data from landsat satellite have been utilized in Ministry of Agriculture for the last few years to recongnize and assess, land use/land covers in various ways, proving their efficient performances as a good tool, especiallyfor land use mapping and land deduction general. However the advent of the thematic mapper ™ data with high resolution has made the mapping work faciliate better in visual interpretation and analysis of the required object, as such this paper an attempt has been made to extract various information of forest covers and land resources of mazandaran province.
Area
Mazandaran province, with an area of about 46o,456' sq.km, lies between 50, 15' and 56o,15' eastern longitudes and between 35o,45' and 38o,15' northern latitude in northern Iran. Due to the proximity of the Caspian sea on the north and Alborz mountain on the south and also its abundant superficial water resources, the province enjoys a quasi-Mediterranean climate which makes, it favorable to agriculture, Rice, Cotton, and Forest, Citrous fruits, constitute the main crops of Mazandaran province.
Method
Considering the scale of the landsat thematic mapper (TM) data in bands 2, 3, 4 in the moth of JUN, JULY, JAUNARY 1990, 1991,1993,1994 at the average of 1:100000 scale were applied, the total image was 14 quardrants which cover the Mazxandaran province. For visual interpretation, analysis as reflected through the image characteristics, during the moth of July when the data were scanned most of the agriculture are were harvested or in some part wee not devoid of agriculture, consequently the radiant energy which produced the spectral signature mostlyfor the harvested surface, with communicated a better and usefull-idea to the interpreated that the various image characteristics recorded on the imagery were mainly due to the variation of agriculture area and soil color with the color of exposed stones, and rocks, bare surface in the visual interpretation of satellite images, forest areas were differentiated as a main landuse class and subdivided into subclasses corresponding to different densities, and utilized 1:25000 scale forest typological maps prepared by the forest and range organization. All these interpretation units were correlated and joint with available. C.C.T data in the Mazandaran province, the landue/land covers units wee extracted before collection ground truth for compaced interpretation unite boundary with digital analysis unites and utilized of C.C.T thematic mapper data for land use, the repeated ground controls wee again carried out where necessary, and after the completion of the interpretation of each quardrant of the completion of the interpretation of each quadrant of the satellite images and the appropriate correction were again made, it s notable that in some cases the Global positioning system (GPS) was used to correctly locate certain ground samples.
Material
This project was performed utilized in the preparationof land use maps of Mazandaran area 1:50000 and 1:250000 scale topographic maps 1:250000 scale land capability maps produced by the water and soil research instiute.
1:25000 scale topographic maps produced by the forest and range organization.
| Sensor | Date | Pixel | Scale |
| Land sat-TM Image | june 1991 | 30x30 | 100000 |
| july 1991 | 30x30 | 100000 | |
| June 1994 | 30x30 | 100000 | |
| January 1993 | 30x30 | 100000 |
| Land sat-TM | Designation | Wavelenght |
| c.c.t. July1994 | 1 | 0.45-0.52um |
| 2 | 0.52-0.60um | |
| 3 | 0.63-0.69um | |
| 4 | 0.76-0.90um | |
| 5 | 1.55-1.75um | |
| 7 | 2.08-2.35um |
Spectral bands of the sensor
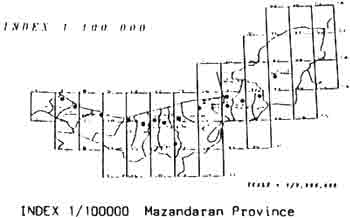
index 1/100000 Mazandaran Province
Measurement of land unite surface:
The area of important land use classes of Mazandaran, are as below.
| No | Land use class | Area(ha) | Percentage |
| 1 2 3 4 5 6 7 8 9 |
Irrigated
agric Dryfarming Total Orchard Forest Land Range land Bare land Urban, rural Superficial Water badies Wet land |
487218 447480 984708 102342 1397975 1788218 55809 14958 25210 23033 |
10.49 10.71 21.20 2.20 30.10 38.49 1.20 0.32 5.39 0.50 |
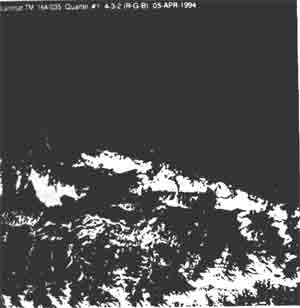
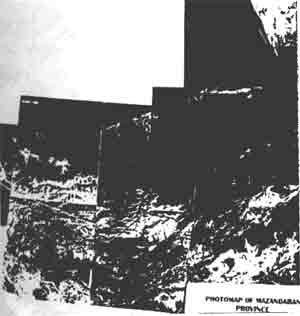
Image Of Study Area
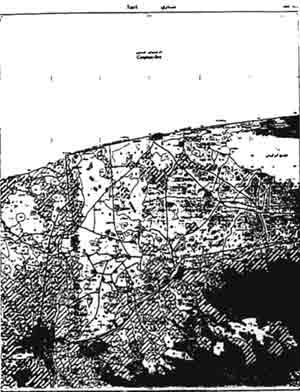
Image of Landuse Classification Map
Image Processing and Classification
Digital image processing is the numerical manipulayion of digital image and includes preprocessing, enhancement and classification, preprocessing refer to the internal processing of the raw data to calibrate the image radiometry, correct geometric distortions and remove noise the nature of the particular preprocessing required obviously depends strongly on the sensors characteristics, because the preprocessing is designed to remove any sensor the corrected image are then submitted to enhancement produces a new enhanced image that is displayed on a (CRT) for classification, this enhanced image may be easier to classify than the original in different way.
Supervised Classification
Supervised classification proceduses are the eassential analytical from the extraction of quantitative information from remotely sensed image data to decide the set of ground cover type in to which the image is to be segmented these are the information classes just like urban, area water bodies crop land. Range land, than choose reprecentive or prototypc pixels from each of the desried set of classes, these are pixel as a train data, training sets for each class canbe estabilished using the training dat ato estimate the parameters of the particular classification algorithm to be used. These parameters for a given class make signature of that class so that these signature apply the trained classify every pixel in the image in to one of the desired ground cover type (information classes) here the whole image segment of interest is typically classified, then these classification are overlay with interpretation base map joint together. Show fig.
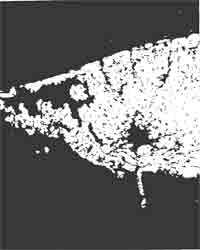
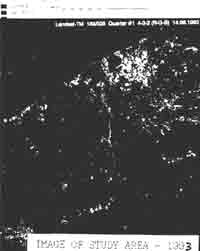
image of study area 1993
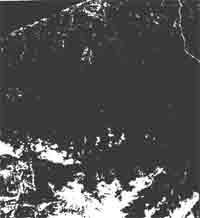
image of study area 1994
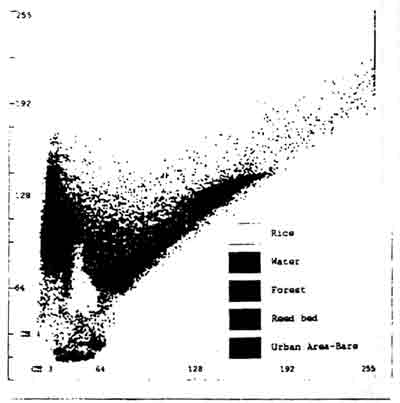
Scatter Plot of study area 1993
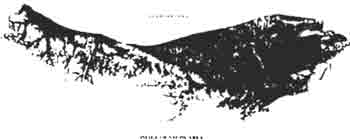
image of study area 1993
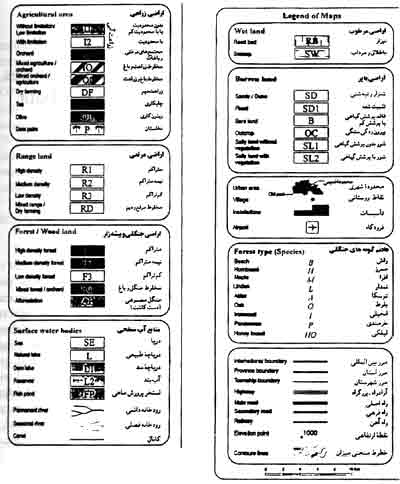
Landuse mao legend
Conclusion:
This project has been done by using Landsat thematic Mapper ™ data for mazandaran Province and Could effectively and quickly be used For monitoring of landsat/ land cover.
The agriculature units were delineated based on color theme differences on the TM images through visual interpretation and were corrected by combination of digital analysis of TM data and the data obtained from ground truth.