| GISdevelopment.net ---> AARS ---> ACRS 1997 ---> Land Use |
Reserch The System
Environmental Change Extraction using Satellite Data
Toshihiro Kadowaki,
Yoshikazu Fukushima, Hiroshi Masaharu, Keisuke Katsuta, Tsuneaki
Shimoji,Yoshiyuki Mizuta, Valairat Wanpiyarat* Damrong Buapradabkul*
Geographical Survey Institute, Kitasato-1, Taukuba-Shi,
*Department of Land Development, Phahoyothin Road,
Bangkok 10900 Thailand
Abstract
Geographical Survey Institute, Kitasato-1, Taukuba-Shi,
*Department of Land Development, Phahoyothin Road,
Bangkok 10900 Thailand
We developed the system for environmental change extraction using satellite data, that is 1) develop method for land cover change extraction using satellite data, 2) analyze environmental change using Geographical Information System (GIS) and 3) make manual of interpretation for microwave imagery using composition of LANDSAT-TM and RADARSAT imagery. The study area of this research is located in Ban District, RAYONG province, 185 km south-east of Bangkok in Thailand. The environmental of the area is rapidly changing environmental for the land improvement and urbanization.
In this research, we could analyze quantitative relation between environmental change with land cover and geographical data. And we could interpret more clearly cultivated boundary and kind of plant using microwave imagery.
1.Introduction
It is important for every in the topical climate to solve environmental problem, for example reduction of forest, increasing desert and urbanization. For solving this problem, it is necessary to get the information of topography and land cover and to understand and analyze environmental change. And there is a lot of demand for getting those information from social viewpoint of environment problems on the earth.
In this research, the Geographical Survey Institute (GSI) of Japan and the Department of land Development (DLD) of Thailand has jointly researched from 1995 to 1996. Items of this research are as follows,
- To develop the extracting environmental change during several year
using satellite data.
- to make out land cover maps using satellite data
- field reconnaissance survey
- To develop the method of environmental change analysis using GIS.
- change of land cover overland with geographical data
- to analyze environmental change using GIS
- To make the manual of interpretation for microwave imagery.
- to make out composite imagery of LANDSAT-TM and RADRAST
- to make out the manual of microwave imagery
2.1Develop the method of environmental change extraction using satellite data
The whole process is shown in figure 1 we made two land cover data using maximum likelihood classifier from LANDSAT-TM imagery. Next step, the mistake pixel in selected change pixel is corrected using the method that compared the pixel and pixel of neighborhood in the definite square area. And we could understand the change process for land cover due to construct two land cover imagery of pixel by pixel.
Figure 1 Flow chart of 2.1 processing
The classification items and change process for land cover was decided as follows, classification items of land cover
- sea and reserved water
- city
- rice field
- pineapple
- mix-orchard
- rubber
- wasteland
- field
- forest
- forest does not increase
- field does not increase
- rice field does not change, but it changed each season
The whole process is shown in figure 2.
figure 2 Flow chart of 2.2 processing
- Geometric correction to UTM coordinate system.
In order for land cover imagery to be overlaid with geographical data, both land cover imagery were geometrically corrected to UTM coordinate system (UTM zone 47, unit m) using thirteen ground control points (GCP). - Land cover map using satellite imagery
Land cover map was made of land cover imagery and geographical data. Those are road, river and contour line on scale 1:50,000 topographical map by digitizing method. And change extraction data was composed of two land cover as same as 2.1. - Analysis
In this research, we get proportion of change by buffering method on GIS and understood characteristic of environmental change of the study area.
Also, we understood relation between elevation data and change extraction data.
2.3 Make the manual of interpretation for microwave imagery
- Manual of interpretation for microwave imagery
In order fill up manual of interpretation for SAR (Synthetic Aperture Radar) imagery in phase I (Hiromichi, 1995), we obtained additional ground truth with filed reconnaissance survey using RADARSAT imagery of high resolution. And we argued with staff of DLD about result of field reconnaissance survey and kmicrowave imagery. - Specification of manual
The manul of interpretation for microwave imagery has LANDSAT-TM imagery, RADARSAT imagery and composite imagery of both satellite for each category. Still more, it put on field photograph and each category. Each classification category are 9 items same as(1).
3.1 Develop the method of environmental change extraction using satellite data
The result of land cover classification on two different times is shown in figure 3. The X axis is category. The Y axis is land cover proportion on two different times (1987,1995). The large attention points were decrease of field, increase of pineapple and urban as a large change. We could guess that turning into housing and spreading agricultural land had changed from the area of field and waterland. The influence of the land improvement around the large reserved water on north-west area could be guessed from the result of classification too. In the future, the north-west area will change because the purpose of the large reserved water was industrial water.
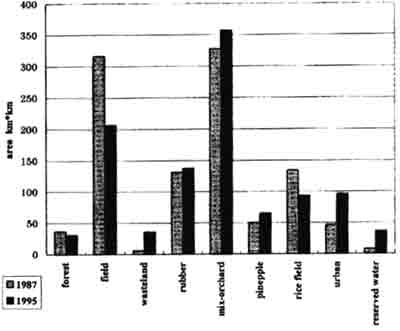
Figure 3. Land cover of each items
The change process flow chart of land cover is shown in figure 4. The selected items of change are large change proportion so that it represents the improvement of land and urbanization, were referred to opinion staff of DLD. The figure above arrow was shown the area (km x km) of change. Even if only two different times data were used to classify and extract the change, we could guess rough process of land cover in this area. For example change process was guessed as follows.
Figure 4. Change flow of land cover
Pineapple and mix-orchard, rubber and mix-orchard were used land by reciprocal relation. And we could guessed that increase proportion of field ® pineapple, decrease proportion of mix-orchard. The change of land cover has close relation with soil, which was difficult to change form of land use. In this area, it has characteristic that land use depend on soil of geographical. The plantation was in order of gentle slope, which was rice field ® mix-orchard ® pineapple, rubber. So we could understand that the area of gentle slope spread due to improve land.
3.2 Develop the method of environmental change analysis using GIS
The land cover map that was overlaid with geographical data which were road, river and controur line, executed geometric correction is shown in figure 5. We could visually understand land cover due to be overlaid with geographical data. The land cover was divided from road and river. Particularly, we could understand that a lot of urban area existed around the road and river, pineapple existed more elevated than mix-orchard rubber was located along divided the river.
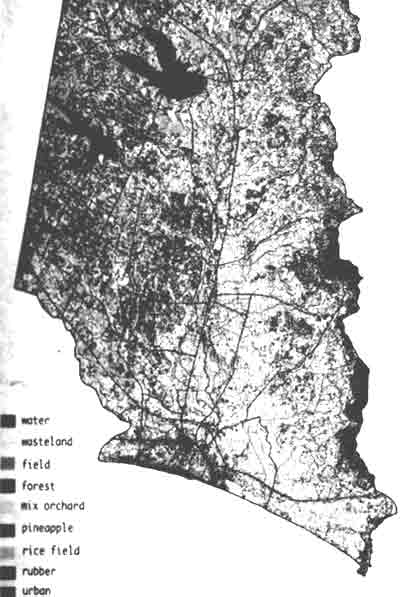
Figure 5. 95 Land cover map
The overlaid change extraction with geographical data was shown in figure 6. We could visually understood that the parts of change extraction had close relation with geographical data. And it was clearly understood that a lot of change of urban was around the road, changed a lot of pineapple in north-west area and did not change in east area.
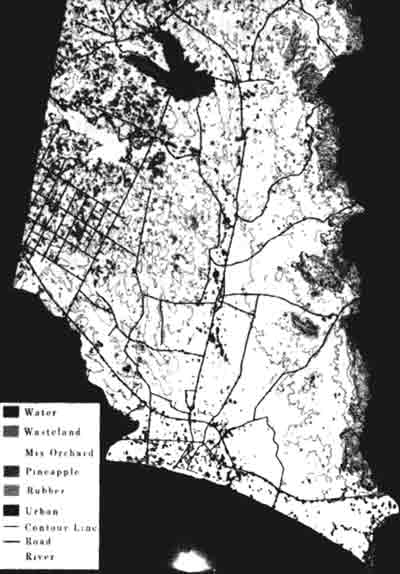
Figure 6. Composite map of land cover change
The result of spatial analysis from road and river using buffering method was shown in table 1.
| Items of change | Distance from road | Total | ||||
| 100m | 300m | 600m | 1km | Over1km | ||
| Pineapple | 9.4 | 20.7 | 22.3 | 20.0 | 27.5 | 100 |
| Reserved water | 8.9 | 20.2 | 26.2 | 23.6 | 21.1 | 100 |
| Rubber | 4.9 | 9.9 | 14.7 | 17.6 | 52.9 | 100 |
| Wateland | 1.7 | 4.9 | 7.1 | 11.5 | 74.7 | 100 |
| mix-orchard | 6.1 | 13.5 | 16.5 | 19.6 | 44.3 | 100 |
| Urban | 22.4 | 24.1 | 22.2 | 15.1 | 16.2 | 100 |
| Items of change | Distance from road | Total | ||||
| 100m | 300m | 600m | 1km | Over1km | ||
| Pineapple | 9.2 | 32.2 | 36.4 | 17.2 | 5.4 | 100 |
| Reserved water | 29.6 | 34.8 | 21.7 | 9.5 | 4.4 | 100 |
| Rubber | 13.7 | 22.7 | 27.4 | 19.2 | 17.0 | 100 |
| Wateland | 9.0 | 21.7 | 28.7 | 23.5 | 17.1 | 100 |
| mix-orchard | 10.5 | 22.4 | 26.7 | 22.3 | 18.1 | 100 |
| Urban | 17.8 | 28.8 | 25.1 | 15.2 | 13.0 | 100 |
We could executed quantitative analysis using buffering method. For example, change of urban was about 50% within 300m within 300m form. Change of mix-orchard, rubber and wasteland were not about 50% within 1km from road. Change of all items were about 60% into 600m from river. We could understood that a lot of change of pineapple is elevation from 50m to 70m, a lot of change of mix-orchard was elevation from 20m to 50m and a lot of change of urban was elevation from 0m to 20m.
3.3 Make the manual of interpretation for microwave imagery
- Interpretation of RADASAT imagery
RADARSAT imagery has easily interpreted vegetation due to difference of wavelength and off-nadir angle view of comparing RADARSAT with JERS-1 of microwave sensor.
Interpretation of the boundary of cultivated area and roads of Urban area so as line objects has improved from high ground resolution of RADARSAT sensor. Pineapple area which lies between the both Reserve Water area in study area is difficult to interpret even OPS sensor or LANDSAT-TM. The area is mixture area of field, mix orchard and pineapple. But we could interpret their items using different back scatter of RADARSAT imagery. Forest and Wasteland area has tendency of clearly ridge line. Particularly Forest area shows strong back scatter from all kinds of filiage. But difference between Forest and Wasteland have difficult interpretation caused by characteristic of back scatter.
Details of each interpretation items are shown by microwave image interpretation manual in this report.
- Interpretation of composite imagery
In the case of rubber area dotted with field, interpretation on RADARSAT imagery was difficult because of some radiance value. But the field appears as the light green than rubber in composite imagery.
As the judgment at the rubber area or the mix orchard area, difference of both can be confirmed so as colors in the composite imagery. Rubber area is uniform purple, mix orchard area is purple and white intermingle. It's difficult as above-mentioned in case of RADARSAT imagery.
In this research, we could understand as follows,
- The visual understanding of environmental change is improved by overlaying topographic map and extraction imagery of land cover change.
- The environmental change can be quantitatively analyzed by GIS.
- The interpretation of detail is improved by using microwave imagery.
And we can do accurate interpretation of road, river and cultivated boundary by making out manual of interpretation for microwave imagery. In the future, we think that need to continue to execute research of the microwave imagery.
Reference
- Kunio NONOMURA, Tadao HOYA, others, "Research on the Land Use in the Tropical Zone", Technical Report of Joint Research on the Enhancement and Application of the Remote Sensing Technology with ASEAN Counties (Phase II), 1991.
- Hiromichi MARUYAMA, Hiroshi MASHARU, others, "The research on methods for surveys of topography and land use using remote sensing data", Technical Report of Joint Research on Environmental Change in Tropical Report (Phase I), 1995 (in Japanese)
- Earth Remote Sensing Data Analysis Center, "Synthetic Aperture Radar (SAR)", 1995 (in Japanese)