| GISdevelopment.net ---> AARS ---> ACRS 1997 ---> Land Use |
Operational Urban Sprawl
Monitoring using Satellite Remote Sensing: Excerpts from the Studies of
Ahmedabad, Vadodara and Surat, India*
P. Jothimani
GPS/GIS System Division,
Hitachi Zosen Information Systems Co., Ltd.
7-37-10, Nishi-Kamata, Ota-Ku, Tokyo 144, Japan
Tel: 81-03-5711 5325 Fax: +81-3-5711 5371
E-mail :jo@gps.hzs.co.jp
Abstract GPS/GIS System Division,
Hitachi Zosen Information Systems Co., Ltd.
7-37-10, Nishi-Kamata, Ota-Ku, Tokyo 144, Japan
Tel: 81-03-5711 5325 Fax: +81-3-5711 5371
E-mail :jo@gps.hzs.co.jp
Urban sprawl mapping and monitoring is one of the operational applications of satellite remote sensing data, irrespective of its spatial and spectral resolutionof the satellite-borne sensors. From the earliest data (Landsat-MSS) with comparatively coarse resolution to the present high spatial resolution data (IRS-1C panchromatic), detecting the changes in land cover and its use, especially the delineation of built up environment has been proved efficient. The visual interpretation techniques which has an edge over the digital analysis and interpretation of the built-environment has been advocated in conjunction with the topographical maps to operationalize the techniques. This paper presents an attempt in this direction to map the sprawling trends and changes in the urban core using topographical maps and IRS-LISS II data with the case studies of ahmedabad, Vadodara and Surat (of Gujrat state) cities of India. The SPOT data has been used as Ground-truth control data in most of the situations. It is also evidenced that even with very coarse spatial resolution of the satellite borne sensors the data also being discussed and viewed as a bottleneck for research and other purposes of study of urban areas.
Introduction
Urban form and the structure of Indian cities are mostly evolved through the ancient urban core as well as the current sprawling urban corridors into the rural fringe agricultural areas. In the emerging scenario in the world it is estimated that around 50% of the total global population shall be urban by 2000 A.D. and 2/3 of these will live in cities and towns of less than 1 million (World Resources Institute, 1995). In India alone 1/3 of country' total population will become urban.. So it is essential to have updated information on urban growth patterns and its impact on the living environment. It is also observed by various studies that current trends of spatial urban growth pattern is haphazard along the rural-urban fringe areas. So there is an obvious need for periodic studies on current phenomena of growth patterns. The haphazard growth patterns along the transitional rural-urban (rurban) areas as well as the densely populated dynamic urban core is of great concern to the urban administrators and planners. In order to provide basic amenities and infrastructure for complex urban environment, the up-to-data information pertaining to the dynamic processes within and around the city regions shall be of immense value and use to the planners and Administrators. Satellite Remote Sensing, with repetitive and synoptic viewing capabilities as well as multi-spectral capabilities is a powerful tool to map and monitor the emerging changes in the urban core as well as in the peripheral areas of any urban entity. Satellite date obtained through the sensor, even with the coarse spatial resolution (minimum unit of detestability) in conjunction with the topographical maps of older origin. Hence the studies recent stage of urban regions. These are comparatively easier task in urban land use oriented mapping than monitoring land use change detection or monitoring in the urban core.
Satellite Data Based Urban Land Use Inventory
Multi-temporal and repetitive satellite data offer unique opportunities for mapping and monitoring some of the elements of urban core, its dynamics and the resultant urban structure. The complexities and elements of urban dynamics as well as the required satellite data characteristics are controlling factors in urban inventory and analysis. With careful analysis and assessment of satellite data capability, and also with the experience gained through earlier studies with IRS satellite date, this study is limited only to the delineation of major classes in urban core as well as urban sprawling trends. SPOT satellite data (MLA) have been used and analysis. Satellite data based mapping and monitoring has its own limitations in terms of monitoring the elements of urban dynamics. At very coarse or preliminary level of mapping using the satellite data would be delimitation of built-up space, vacant/open spaces, recreational zones, industrial sites and other emerging suburban zones. The nature and interpretability of satellite land data decides the accuracy levels as well as the possible constraints in identification of urban features. Very fine resolution in the order of 5 meters will enable us to map urban land uses in level III or more (Welch, 1985). This attempt of delimiting the sprawling suburbs, is to identify the zones of growth as well as the emerging suburban land uses such as developing in industrial/residential cluster and dynamism in rural urban frige agricultural areas. These thus help in identification of typical and use zones and its territorial association to its urban core of the region shall enable to derive the emerging spatial urban structure. These process of evolution with reference to time and space forms essential component of the current dynamic phenomena of urban structure. (Figure 1.)
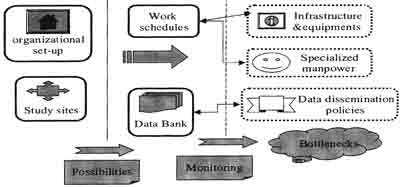
Figure 1. Functional requirements for Operational Urban monitoring and bottlenecks
Operational urban sprawl monitoring requires a functional system (Figure 2.) that enables consistent mapping and monitoring. It has been widely observed that data dissemination policies become a hurdle in a research and academic environement.
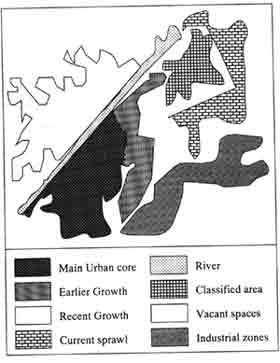
Figure 2. A typical sketch of a settlement environment and its morphology
Objective, Study Area and Data Used
Broad objectives are: I) to delineate major urban land uses classes (wider in geographical sense) using IRS LISS - II satellite data ii) mapping and analysis of trends of urban spread and its emerging urban structure iii) to evaluate the usefulness of IRS satellite data in conjunction with 'topographical maps' for consistent mapping of growth profiles of urban sprawling. The study conducted in three major metropolitan cities of Gujrat state in Western India. All these three cities are located or along the river or riverine plains.
| Study Area | Topographical | IRS-LISS-II | SPOT PLA |
| a. Ahmedabad | 1956/68,1972 | 21.10.90 | 13.01.88 |
| b. Vadodatra | 1955/56, 1970 | 5.3.89 | 23.11.90 |
| c. Surat | 1949, 1972 | 5.3.89 | 1.4.89 |
Methodology
Based upon the visual interpretation techniques of satellite data, various land uses have been interpretation and delineated. Major attention is given to delineate the broader levels of land use zones within the old city areas, the details are classified oriented towards urban structure rather than typical land use/cover mapping. Feature verification and incorporation done using SPOT data, wherever necessary in order to ascertain typical land use zones like emerging built-up zones, areas under sparse built up/under development. The earliest IRS satellite data based demonstrative studies shown the potentiality of possible applications in urban settlement analysis (pathan and Jothimani, 1989; Pathan et al 1991, Raghavswamy et al 1989, Behera et al 1990) and its also utility of LISS -II in urban related applications. Thus this tudy was aimed only to map regional settlement land use patterns such as dense built-up, sparese built-up, built-up mixed with habitations, industrial zones, recreational areas, open/vacant spaces and the emerging settlement clusters. Features verifications and incorporations were done using SPOT MLA data where ever necessary. IRS LISS -II data based delineation of land use clases enabled to identify the emerging land use zones to associate and analyze the spatial pattern of growth profiles and its pattern of evolution.
Results and Discussion
- Ahmedabad
Earlier attempts on urban sprawl mapping on 1:50,000 scale with visual and digital interpretation techniques using the muti-data satellite (Landsat MSS, TM and SOPT MLA/PLA) data by Pathan et al, (1991); land use change studies using Landsat MSS data of 1975 and 1982 by Rao et al, (1983) reveal the overall the overall growth of built -up (both residential and industrial) areas into the peripheral rural areas. As on 1973, from Surveyof India Topographical maps (hereafter called as 'topomaps') of 1973/70 (surveyed 1970/1956 respectively) shows that the city was spread upto Vastrapur (S), Vasna (SW), Chandola lake/maleksabhan stadium (S), Sabarmathi(NE), and isolated industrial suburbs of Vatva and narol (extreme South). The 1990 satellite data revealed that the spread is haphazard and sporadic in the West (Jodhpur/Vejalpur/Vastrapur and upto Sarhkej highway) as well as in isolated clusters beyond the metropolitan boundary (Bopal and Ghuma villages). There are also ribbon development patterns along the railway line towards Vatva, a industrial node in the South and along the road (Highways) network near Nariol- Lambha, Vasna- Sarkhej in Southwest, Ramol and Vinjhol in SouthEast, and Odhav industrial suburbs in East. The spread is also observed beyong Ghatlodhia, Sola and Thaltej in Northwest (bordering the highway) and also towards Chandkheda Cricket stadium near Motera village.
- Vadodara
Urban spread was delineated using 'top maps' of 1960 and 1973 (surveyed in 1955-56 and 1969-70 respectively). Exiting pattern of built-up area was delineated using 1989 IRS LISS-II data. It was observed the rural-urban fringe was located near Alkapuri (NW), Danteshwar (SE) and Harni (E) during 1960s. During 1973 urban clustes were seen near Gorwa, GSFC industrial estates ans also near Bajwa (NW). Growth is also observe near the residential areas in the South. The study of land use expansion using satellite dat aof 1985 outlined the faster expansion of residential areas near the industrial belt of GSFC (Trevor1989). The recent IRS-LISS II satellite data of 1990 (also verified with the SPOT MLA data of Nov,1990) shows sprawling along the extensive tracts of Western Alkapuri, emergence of industrial estates near Nandesari andRanodi and the continuance of sprawl near Harni (N) and beyond Dantehwar (NE) areas. It is also there is adevelopment of site northeast of Airport.
- Surat
As observes from 1951 top map (surveyed in 1949) the built-up area limits were just confined to Bhestan (S) and Vireo village in nourth bordering estern banks of river Tapti and an isolated cluster of Udban in the south-east and Adajan to the west of the river. During early eighties (from the topomap-surveyed in (1970-72) the longitudinal belt of suburbs bordering east of river Tapti, west of Udhna, near Aadjan in northwest of th eriver and the eastern suburds were the peripheral areas of the main urban core of the city. Earlier attempt of land use change detection using aerial photos also recealed the growth ternds in the suburban areas (Kalubarme et al 1985). The observations based on the satellite data of IRS-LISS II of 1990(verified with SPOT MLA data of Nov 1990) showed the ribbon development, all along the transportation network, especially between the river in the railway lines (near Udhna, Bhestan (S) and Magdala, Sarasana (SW) toword airport, Rapid growth was also observed near Adajan. Palanpore, Bhatha and Bhestan (all west of the river) and towords IFFCO/ONGC of Bhatpor/Chipore/Jahangipura in the North. Spare built-up growth also observed along both sides of railway radiating from city towords north, bordering highway road (NH8) in East of the clusters near Udhvan (NE). growth is also observed between road and railway line north of th eriver as well as along the roads, west of the river. The industrial clusters are near southern corridor along th erailway line, where new spare residential areas have also emerged near Pardi kande village.
The dense built-up (the urban core) encircling the moderate built-up (outer urban), spare built-up (peripheral suburbs) and the industrial sites lying mostly outside the city limits are the distinct characteristics in all the there cities. Mostly the recreational areas, such as parks and gardens are of older origin (except stadiums in the outer urban zone). Public/semi-Public/ Educational institutions lie also in the inner/outer urban. The sprawling of residential built-up area towards the outer peripheral industrial zones as well as all along the transportation network as well as toward industrial nodes. The present urban from also. includes the emergence of isolated residential suburbs bordering the metropolitan limits in case of Ahmedabad and Vadobara. In case of Surat ribbon development was observed. The spital association of broader land use zones mapped in all these cities reveal the new trends of emergence transportation network in case of Surat and Ahmedabad. Viz..( adistnct departure from the old fortified walled cities) altogether may lead to the formation of 'tar-like' rban structure with the tiny urban core and the sprawling suburbs.
Acknowledgements
This paper is a revised of the paper presented at the annual meet of National Association of Geographers India during 1992 with appropriate permission from the ISRO authorities. Author wishes to thank Dr. Baldav Sahai (Ex Deputy Director, Remote Sensing) for encouragement and guidance thorught the study. Dr. R.R. Navalagund, Group Director, RSAG/RSA, Dr.A. Narian, head, Marine and Water Resources Division, reserves my gratefulness and thanks for his keen interest and suggestions throughout this work. Thanks are due to Dr. Pravan .S.Desai, Head Meteorology & Oceanography Division, for his comments, suggestions and inputs. Thanks are also to RM pandya and his colleagues for timely help. Dr.(Mrs). Anjana P.Desai, enthusiastic guidance and imputes is gratefully acknowledgement
Selected References
- Behera G.and others (1990) urban land use studies of Bangalore and its environs, Scientific Report, NNRMS, Bangalore, India.
- India Today, (1992) White Elephant in the space. June 1-15, New Delhi, India.
- Jothimiani, P.(1992) Mapping and monitoring of urban structure and its evolution using Topographiocal maps and IRS-LISS II satellite data paper presented at the Annual meet of the National Association of geographical India, December 26-29, Jaipur, India.
- Kalubarme. M.H, Baldev Sahai. S ans Aurani, A.U(1995) Land use change detection studies of surat city ,ACRS, srilanka
- Naryan L.R.A(1996) IRS-1C data opens up the possibilities for detailed mapping. The Hindu, Madras
- Pathan, S.K. and Jothimani.P.(1985) Mapping and monitoring of urban sprawal using Landsate MSS data: case studies of there major cities (Rajkot, Bhavangar, and Jamnagar) of saurashtra region, Gujarat, Proceedings of ISRS symposium on Remote Sensing for planning and environmental aspects of urban and rural serrlements ,Visakapatanam,India
- Pathan, S.K. and Jothimani.P.(1989) Mapping And Identification Of Land Cover Features Around Madras Metropolitian Area from Irs-1a, Landsite TM and SPOT MLA/PLA data NNRMS bulletin (B11). Bangalore, India,1989
- Pathan, S.K. and Jothimani.P.R.Patel D.S.Mehta and K.K.Varmaji.(1991) Comparative evalution Of Ahmedabad, Proc, national seminar on ISR-1A and its application potential, Hayderabad, India.
- Raghavawamy and other (1989) Urban land use mapping of Hudrabad and its environs, Technical Report,NRSA, Hyderabad India.
- Rao, M, Thakker P.S and Jaleja.(1983) urban land use change in ahmedabad city using landsat MSS data proceedings of theInternational Symposium on Socio-economic aspects of Remote Sensing" June 83, Yokyakarta, Indonesia.
- Trevor, J.(1989) urban land use change mapping of baroda (Vadodara), unpublished thesis, School of Planning, Ahmedabad, India.