| GISdevelopment.net ---> AARS ---> ACRS 1997 ---> Land Use |
National Scale land use
Change Modeling - Issues and Applications
Ks Rajan and Ryosuke
Shibasaki
IIS, Univ. of Tokyo, 7-22-1, Roppongi, Minato-Ku Tokyo 106, Japan
Tel : (81)-3-3402-6231 Fax: (81)-3-3479-2762
E-mail: rajan@shunji.iis.u-tokyo.ac.jp
Abstract IIS, Univ. of Tokyo, 7-22-1, Roppongi, Minato-Ku Tokyo 106, Japan
Tel : (81)-3-3402-6231 Fax: (81)-3-3479-2762
E-mail: rajan@shunji.iis.u-tokyo.ac.jp
Land use/cover modeling requires a variety of data, ranging from basic physical information to socio-economic data to existing land use patterns. The scale, resolution and the type of data like spatial, temporal or statistical data, needs to be known for the proper usage of these datasets in modeling approaches. The scarcityof finer datasets leads to various assumptions and simplifications in the approach. Also, it has to be noted that a data with less number of classes, leads to the error of the assumption of homogeneity with the given class. The paper presented here will discuss the issues that arose in developing a national scale land use model by the authors for Thailand.
Introduction
Natural forces have always had an influence in the shaping of the earth's surface. Material flows and energy transfers have operated at global, regional and local scales, resulting in both gradual and catastrophic transformations of the biosphere, atmosphere, lihosphere and hydrosphere. However, and cover changes have been the most drastic of all changes and also its interaction with the other global systems/cycles is of prime importance in studies on global its interaction with the other global system/cycles is of prime importance in studies on global change research. Land use/cover is continuously changing, both under the influence of humans and nature resulting in various kinds of impacts on the ecosystem. These impacts at local, regional and global levels have the potential to significantly affect the sustainability of the world agricultural systems and the forest systems. To understand the impacts on the ecosystem, we need to understand the mechanisms of the processes involved. The most important factor in the modification of the land cover and its conversion is the human use component. Changes in the land cover cannot be understood without a better knowledge of the land use changes that drive them and their links to human causes.
The linkages between the human and biophysical causes or drivers to land management and land cover are not sufficiently understood. This arises from the complexity in dealing with the considerable variations in the drivers, use and cover at the local, national and regional levels. At present, many of the global and sub-global analyses and studies capture the broad sectoral trends based on the changes in some of the macro variables, like population, socio-economic trends, etc. The modeling at a national level is more complex than to generate a global picture, while local case studies pose a separate set of problems. They not only do not link well with either the regional or global scale models, but also identify an entirely different set of driving variables than the global scale models. The transformations in the land cover, occurring on the large scale will lead to large scale changes in the "global environment". These changes are complex and require different scales of analysis.
Issues in Modeling
Modeling approaches vary according to the objective of the studies and the type of data available. Models may be deterministic or stochastic in nature; macroscopic or microscopic in extent; evaluation models or optimization models. The modeling approaches also depend upon the type of study carried out in understanding the different aspects of the changes that are taking place. These may be a purely descriptive study leading to a cause-effect type of taking place. These may be a purely descriptive study leading to a cause-effect type of explanation of the changes; or a statistical study with the objective for a probabilistic model at a macro-scale; or just monitoring of changes (with the use of remote sensing technologies) at a spatial and temporal scale. With advances in computing speed and the evolution of better GIS systems, the possibility of combining some of the approaches on a single platform is becoming possible.
An example in modeling:
A framework of the conceptual model for land use change evaluation at the national level and its forecasting is shown in Fig. 1. The issues in modeling are discussed with respect to this framework. Table 1 Lists the data that are used in the model and the minimum required dataset resolution and classification schema required.
Fig. 1. A Simple Framework for Land Use/Cover Change Modeling
| Type of Data | Data Characteristics(min. requirements) | Remarks, if any(Source, limitations, etc) |
| 1. Climatic data2. (rain and temperature) | Point data - have to convert to spatial (grid) data- denser the meteorological stations, the better the interpolation. | Number of WMO stations are limited |
| 2. (a) Elevation data | Atleast 1km DEM data is needed | Available in GTOPO dataset. |
| 2.(b) landuse data | 1km resolution data or digitization of scales higher than or equal to 1:1 million | Classification schema should atleast have the major classes including some of the major crops |
| 3. Population | Urban-rural breakup at local administrative units | In case of Thailand, data at province level. |
| 4. GNP & Income Levels | Available only at the national level, used as an index of affuluence | |
| 5. Costs of Production and Price of Products (Agricultural) | Non-spatial, so data at the lowest administrative level best. | Depends on the data collection agencies. |
The crop-wise productivity estimation requires a set of physical and climatic data. The data on rainfall and temperature is of prime importance in estimating the rain-fed potential of a given area. The better the precipitation data, the easier it will be to demarcate the growing seasons of different regions. In our study, initially we sourced our data from the Global Daily Summary (1994), which gave us a set of 62 stations for Thailand. The reliability of the interpolated precipitation data was not very good. So, we collected data from all the rain-gauge stations in Thailand, a set of 517 stations, and then created the rainfall map. It is clear from Fig. 2. that atleast a decent spread of meteorological points are needed to derive the rainfall distribution.
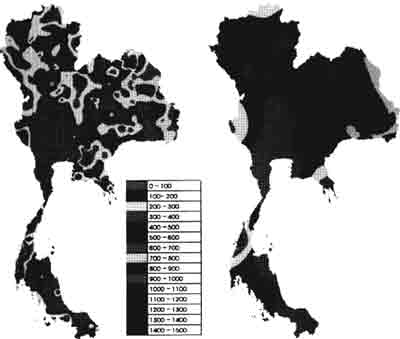
Fig. 2. Rainfall distribution of Thailand for the month of August 1991 (Data is interpolated from - Left: 517 rain-gauge stations and Right: 62 stations)
Similarly, the elevation data is of importance in deriving a lot of variables of the model, such as potential evaportanspiration, transportation coasts, etc and hence needs to be accurate enough to a certain degree. We adopted the method of deriving the DEM data from digitized contour maps, as there was no digital DEM data available. The digital elevation model was derived from 100 m contour lines by applying spline function. The DEM that we arrived at had some anomalies, especially in the central and north-eastern plains of Thailand. The recently published one-km DEM data from the GLOBE project (1997), shown in Fig 3., is a much better dataset, which helped us overcome some of the errors that we had encountered earlier.
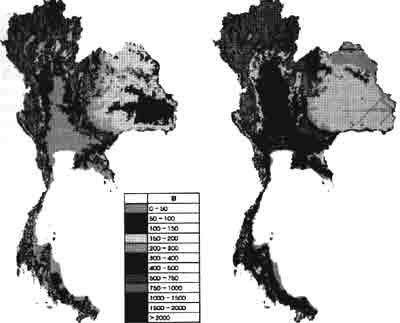
Fig. 3. Digital Elevation Model of Thailand, reclassed for this figure (Left: from GLOBE project; Right: interpolated from 100m contour data)
Also, of importance is the Land use/cover data. The resolution and classification of the land use/cover data is of great significance when used for validation of the model results. If one has a data which delimits only the major landuse categories like paddy, crop, forest, urban, etc., then it is difficult to validate the simulationof changes withing that landuse like changing from data handling and proper reclassification. Fig 4. shows the two different sets of landuse data that was obtained from the relevant sources.
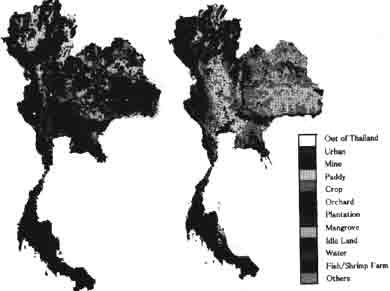
Fig. 4. Land Use maps of Thailand, 1990 (Left: Map showing 193 classes; Right: Map showing only 13 classes
Among non-spatial data used in land use/cover modeling, socio-economic data like population, and GNP are the major ones. GNP is used as an index of affluence and gives information on the consumption patterns of a country. While considering such data, it is necessary to develop scenarios and provide the possible combinations, of effects under these various conditions. Population distribibution and its breakup (rural-urban, agricultural labourers, sex) is also of importance in combining the social component into the model. The level at which these figures are available, will make a lot of difference in the effects generated due to shifts in these.
Application of Land use Models
Most of the global physical and biological models that have been developed for the understanding of the various parts of the global earth system, are dependent on the land use and land cover information as these with their control on the albedo and water & nutreient cycling establish the boundary conditions to these models (Robinson, 1994). Changes in land use/cover bring fundamental changes in the earth system, and these changes are unable to be accounted for by the global models, as they lack the ability to generate any comprehensive land use projections for linked to any such land use predictive models. Such a lack of the framework for the land use/cover trends means that the cause for changes are understood at a level, that is too general to provide any guidance to policy formulations at the national level and research priorities.
In a discussion on the effects of climate change on agriculture and future impacts on global food system, Parrry et. Al. (1994) show that the use of specific national model are required, in combination with the regional scale models to capture the true dynamics of changes that may result in the supply of food. Also, for arriving at major initiatives at the national and regional levels to protect the environment and to proceed towards sustainability, it is necessary to have models at the national-scale to give concrete information on the possible causes. Also, models with a flexibility towards scale of the domain of analysis will go a long way in providing appropriate information for planning at the various levels.
Discussion and Conclusion
The global and regional studies of landuse changes identify the so-called PAT variables (population, affluence and technology) as having the strongest statistical correlations with the environmental change, often implying that the specific variables in questions are the underlying driving forces of change (Veldamp and Fresco, 1996b). Such results may reflect the problems of aggregation of the data for the analysis. It may also result from the subjective considerations that may creep into the study or due to the complexity involved in scaling the spatial and temporal aspects.
At present, ther is only IMAGE2 model (Alcamo et al., 1994), a global model integrating agricultural systems, food supply and other environmental issues. It has a compreshensive model for land cover estimations that is linked to the demands of the agricultural sector (Zuidema et al., 1994). The simulations consider human driving forces as population, GNP and technological developments based on scenarios for 13 world regions. But these do not consider the adaptations that may take place and hence its feedback. Most of the models are successful within their limited domains of validity and scale. No inter-scale dynamics are considered in most of these models, and as long as this is not done, it is difficult to get realistic simulations.
Recently, a new model CLUE (Veldmamp and Fresco, 1990a) was developed as a dynamic model to simulate conversion of land and its effects. It brings about change in land cover, at the sub-national level based on the interaction between the biophysical driver and human drivers. The model is based on rules derived from qualitative information, and includes feedback loops of effect to land condition assessment. In a test application of the model for simulation simultaneous local, regional and national land use/cover changes in Costa Rica, readily available data at the national scale was used. The authors observe that even though there are no methodological constraints to scale down and/or up and to link up with other models, there exists data limitations that prevent such an exercise.
Form the above discussion, we can conclude that the issues of dataset resolution, classification and its quality will matter a lot in the formaulation of the models. If a model is developed based on the known physical and qualitative information, then it needs to be further tuned to the area of application, and may need to be readjusted depending on the data used. So, the development of a robust framework of the land use model is necessary to accommodate the experiences of modeling in one country to its surrounding nations.
References
- Alcamo J., et. Al., 1994. Modeling the global society-biosphere-climate system. 1. Model description and testing. Water Air Soil Pollution., 76: 1-35.
- Global Daily summary., 1994. Temperature and Precipitation 1977-1991. National Geophysical Data Center, USA.
- GLOBE project., 1997. Global Land One-km base Elevation. National Geophysical Data Center, USA.
- Parry, M.. L., and Rosenzweig, C., 1994. Potential Impacts of climate change on world food supply, IIASA.
- Robinson, J., et. Al, 1994 Land -Use and Land-Cover projections, Report of WG C in "Changes in Land-Use and Land-Cover, A Global Prespective" (ed. Meyer and Turner). Cambridge Univ. Press.
- Veldkamp, A. and Fresco, L.O., 1996a. CLUE: a conceptual model to study the conversion of land use and its effects. Ecological Modelling., 85:253-270.
- Veldkamp, A. and Fresco, L.O., 1996b. CLUE-CR : an integrated multi-scale mode to simulate land use change scenarious in Costa Rica. Ecological Modelling., 91:231-248.
- Zuidema, G., et al., 1994. Simulating changes in global land cover as affected by economic and climatic factors. Water Air Soil Pollution., 76: 163-198.