| GISdevelopment.net ---> AARS ---> ACRS 1997 ---> Land Use |
Land Use-Cover Change
Detection Using Knowledge based approaches: Remote Sensing and GIS
Mariamni Halid
Kalaysian Centre for Remote Sensing (MACRES)
CD 100, Tth Floor, City Square Centre
50300 Jalan Tun Razak, Kuala Lumpur Malaysia
Tel: (603)-2645640 Fax: (603)-2645560
E-mail: ipa@macres.gov.my
Abstract Kalaysian Centre for Remote Sensing (MACRES)
CD 100, Tth Floor, City Square Centre
50300 Jalan Tun Razak, Kuala Lumpur Malaysia
Tel: (603)-2645640 Fax: (603)-2645560
E-mail: ipa@macres.gov.my
Knowledge-based approaches were used to link the field data, local knowledge and the spectral land cover classes to generate the land use change. Field knowledge and spectral land cover was formalized into a "belief" factor. In this method, the maximum values of "belief" factors from land cover and land use change were calculated to detect land use changes. Land use in years 1 and 2 was automatically detected using this approach. If land cover classes were grouped overall accuracy of 78 per cent was reached for 1995. The knowledge-based classification and maximum likelihood classification of 1995 gave lower mean overall accuracy of 44 per cent. However, knowledge-based classification has advantage of quick classification and les field work than maximum likelihood classification.
Introduction
At the urban fringe, complex areas of land cover change are often found, including transformations from rural land uses to residential, commercial, industrial and recreational uses. These change can be monitored using remotely sensed data (in combination with ground survey), either by photo interpretation, enhanced false-colour composite imagery from different dates or by digital analysis of the imagery using change detection techniques (Quarmby 1989). For large areas, however, to the ground surveys and aerial photo-interpretation are impractical due to large amounts of data to be collected (in space and time). On the other hand, aerial photographs in malaysia generally have a 'restricted' status and are classified under military control, and access to them is difficult. Against this background, the potential of other forms of remote sensing needs to be explored. In particular, data from Landsat Thematic Mapper with its spatial resolution and repeated coverage, appear to offer possibilities and potential for land cover map production and monitoring land cover-land use change.
Research has shown that mapping of land cover often is significant by improved using of combination of different techniques (Manier et al. 1984). One example is to use knowledge-based approaches which utilize additional geographical data beside satellite images often with great success (Hutchinson 1982, Peddle and Franklin 1992, Bronsveld et al 1994). Janssen and Middeloop (1992) show used a knowledge-based approach for crop classification of a Landsat-TM image, reported classification improvements of 6 to 20 per cent compared to maximum likelihood classification alone. With the knowledge-based approach interrelationships are
Formalized into a set of rules, and individual pixels are classified by determining the chance/probability of a certain land cover type. Probabilities can be assigned using artificial intelligence or simply by applying a set of logistical decision rules (Shafer and Logan 1987, Srinivasan and Richards 1990).
The main objective of this research is to assess automatic knowledge-based approaches in digital land use change by integrating remote sensing and a geographic information systems. This objective could be achieved through:
- spectral classification of multitemporal images in order to produce land cover maps;
- derivation of land use information from land cover classes by using the out dated land use maps supported by the field knowledge expressed in terms of rules and,
- combination of knowledge on land cover and land use change in order to produce land use change map.
Study Area and Materials
The study area selected eas Rawang sub-district and surrounding areas of Ulu Selangor, Selangor, This area is located within corrdinates of latitude 3o 16' N and 101o 28' O" E longitude and 3o 27' 45" N and 101o 39' 30" e. The total study area is 441 km2. Annual precipitation in this area approximately 240 cm.
Precipitation occurs in two seasons, mainly in April to May and September to November. The relative humidity is 80 per cent due to high temperature and high rate of evaporation. Mean annual temperature ranges from 22.8oC to 33.8oC. The areas is about 87,000. The ethnic group consist of 34 per cent malay, 34 per cent Chinese, 27 per cent Indian and 5 per cent others. In this areas land use-land cover is composed of forest, rubber plantation, oil palm plantation, grass land, closed mining, build up area, homestead garden and village.
De Bie et al., (1995) defined land use as a series of operations on land, carried out by humans, with the intention to obtain products and or benefits through using land resources. Land use is captured by describing the land use purpose (s) and the operations sequence. In this study land use refers only to the purpose (in term of crop or cover types) but not include the operations. The classes are mixture of land cover and land use, they will be referred to as land use or land cover-use.
The materials used were Landsat TM dated 17 April 1988 and 14 October 1995 (path/raw - 127/58), Topographic Map 1994 scale 1:50 000 sheets no 3658 and 3758, Land cover map 1991 scale 1:50 000, Land use Map 1988 scale 1:125 000, ILWIS 1.4.
Methodology
In this study geometric correction was done for the image 1988 based on topographic map sheets no. 3658 and 3758. Image to image registration was done in order to register the image 1995 with geocoded image 1988 (master image) Keeping the root mean square error (RMSE ) less than 0.5 pixels, an image to image transformation model (third order) polynomial) and nearest neighbour resampling was calculated and the slave images were resampled for its pixel by pixel correspondence with the master image. Image enhancement was applied to improve the appearance of images for human visual analysis. For that purpose band selection using Optimum Index Factor (OIF) were use for images 1988 and 1995. All the selected bands were used to produce false colour composite.
Knowledge-based Image Analysis
Feature space plot in two dimensions depict the distribution of all the pixels in the scene using bands 3 and 4 (Figure 1). Feature space plot provide great insight into the actual information content of the image and the degree of between band correlation. Therefore, this feature space partitions can be used as the actual decision logic during the classification (Jensen, 1996). Classification using spectral reflectance classes wee done for all images 1988 and 1995.

Figure 1: Feature space of Bands 3 and 4
Modified Spectral Classification
Modified spectral classification was introduced to compensate the conventional radiometric correction. Prior knowledge about land cover spectral and relations with land use are important, however, in some cases land cover change in land use. Base on spectral reflectance of bands 3 and 4 new value for bands 3 and 4 was calculated using this formula: (Figure 2).
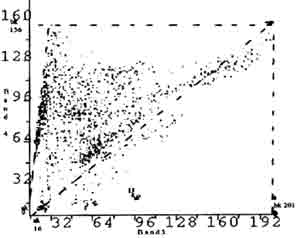
Figure 2: Modification of feature space bands 3 and 4
Where ak= lower value of band k, bk = upper value of band k, to make the value of bands 3 and 4 are equal for every image, so land cover classes based on spectral reflectance could be determined. These transformations results in comparable with feature space plots and images as well.
Land Cover classification
| Band 4 | Band 3 | |||||||||
| 3 | 3 | 6 | 6 | 6 | 9 | 9 | 12 | 12 | 12 | |
| 3 | 3 | 6 | 6 | 6 | 9 | 9 | 12 | 12 | 12 | |
| 3 | 3 | 6 | 6 | 8 | 8 | 11 | 11 | 11 | 11 | |
| 2 | 4 | 5 | 5 | 8 | 8 | 11 | 11 | 11 | 11 | |
| 2 | 4 | 5 | 5 | 7 | 7 | 11 | 11 | 11 | 11 | |
| 1 | 4 | 7 | 7 | 7 | 7 | 11 | 11 | 11 | 11 | |
| 1 | 4 | 7 | 7 | 7 | 7 | 11 | 11 | 11 | 11 | |
| 1 | 10 | 10 | 10 | 10 | 10 | 11 | 11 | 11 | 11 | |
| 1 | 13 | 10 | 10 | 10 | 10 | 11 | 11 | 11 | 11 | |
| 14 | 13 | 13 | 13 | 10 | 10 | 11 | 11 | 11 | 11 | |
Figure 3 Feature space of TM bands 3 and 4 (number indicate cover code : see table 1 for class description)
After the image had been compared, all possible combination of values in bands 3 and 4 were classified according a box classifier (figure 3). With this classifier, the reflectance was 'translate' to cover classes. Using the result of Bronsveled (1994), and personal knowledge of study area gathered during field work, vegetation and soil characteristic can be estimated on the basis of reflectance data in red and infrared. A 'belief' factor was assigned to each label of land cover for each class as land use (table 1).
| code | cover | for | rubfor | op | rub | mh | ra | gl | urb | cons | cl | wb |
| 1 | Dark veg | 0.8 | 0.8 | 0.6 | 0.6 | 0.5 | 0.3 | 0.1 | 0.4 | 0.1 | 0.1 | 0.8 |
| 2 | Mid veg | 0.8 | 0.8 | 0.8 | 0.6 | 0.6 | 0.8 | 0.1 | 0.5 | 0.1 | 0.1 | 0.5 |
| 3 | Light veg | 0.3 | 0.3 | 0.5 | 0.8 | 0.6 | 0.8 | 0.6 | 0.3 | 0.3 | 0.3 | 0.1 |
| 4 | D veg+soil | 0.8 | 0.8 | 0.8 | 0.8 | 0.5 | 0.5 | 0.1 | 0.5 | 0.1 | 0.1 | 0.5 |
| 5 | M veg +soil | 0.3 | 0.3 | 0.5 | 0.5 | 0.8 | 0.5 | 0.3 | 0.8 | 0.3 | 0.3 | 0.3 |
| 6 | l veg+soil | 0.1 | 0.1 | 0.3 | 0.3 | 0.3 | 0.8 | 0.8 | 0.5 | 0.1 | 0.1 | 0.1 |
| 7 | M soil +veg | 0.5 | 0.5 | 0.5 | 0.5 | 0.8 | 0.5 | 0.3 | 0.8 | 0.3 | 0.3 | 0.1 |
| 8 | l veg+veg | 0.3 | 0.3 | 0.5 | 0.5 | 0.7 | 0.7 | 0.8 | 0.5 | 0.5 | 0.3 | 0.1 |
| 9 | m soil+veg | 0.1 | 0.1 | 0.3 | 0.3 | 0.3 | 0.8 | 0.5 | 0.3 | 0.3 | 0.3 | 0.1 |
| 10 | Dark soil | 0.3 | 0.3 | 0.3 | 0.3 | 0.3 | 0.1 | 0.1 | 0.3 | 0.3 | 0.5 | 0.7 |
| 11 | Light soil | 0.1 | 0.1 | 0.1 | 0.1 | 0.1 | 0.5 | 0.5 | 0.6 | 0.8 | 0.6 | 0.1 |
| 12 | V light soil | 0.1 | 0.1 | 0.1 | 0.1 | 0.1 | 0.1 | 0.1 | 0.3 | 0.5 | 0.8 | 0.1 |
| 13 | Water | 0.5 | 0.3 | 0.3 | 0.3 | 0.3 | 0.5 | 0.3 | 0.5 | 0.1 | 0.1 | 0.8 |
| 14 | W/shade | 0.3 | 0.3 | 0.3 | 0.3 | 0.1 | 0.5 | 0.1 | 0.5 | 0.1 | 0.1 | 0.8 |
| Cover-use lable: For= forest, rubber and secondary forest, rub= rubber, mh = mix horticulture Ra= recreational area; gl = grass land ; urb = urban; cons = construction; cl =cleared land wb= water body The cover class- use maps 1988 and 1995 could be derived form new bands 3and 4 | ||||||||||||
Land Use Change
To determine the land use change from land cover change, the average value of land cover chances in years 1 and 2 could be calculated, and the maximum value was assigned for selected land use change class. The land cover and land use change could be calculated as follows:
| BLUC1(date 1-date 2)= | BLU(date1)+BLU(date2) ------------------------------ 2 |
| BLU2 (date1-date2) = | BLUC1(date1-date2)
+BSLUC(date1-date2) ------------------------------------------------------------- 2 |
BLUCI=blief land cover change based on image data.
BLUC2=blief land use change based on BLUCI and belief factor on "succession" of land use change.
Visual Interpret ion
On screen digitizing for visual interpretion was done for image 1995. Image characteristic such as tone, texture colour and pattern are translated into land use attributes. The translation process (transfer function) is guided by local knowledge (e.g land use map, land cover map or agriculture statistic) which were collected during field work or background studies. Polygons are drawn around features (forest, oil palm, rubber, urban, cleared land, grass land, homogenous area, ect) and a label was assigned to each polygon, characterizing it by attributes (the legend).
Maximum Likelihood Classification
Training samples wee first selected from various spectral class for images 1988 and 1995. After selecting the training samples, classification was urn on the data using maximum likelihood algorithm. Grouping of spectral classes were done on the basis of land cover types which are: forest, rubberforest, oil palm, rubber, mixed horticulture, recreational areas, grass land, urban, construction, cleared land and water body.
Results and Discussion
The performance of the knowledge-based classification and multi-source information classification was tested by comparing with conventional visual interpretation and maximum likelihood classification for change detection. A confusion matrix was used to assess the accuracy of each resulting land use by comparing or cross-tabulating the classified land use to the actual land use observed in the field and existing land use map 1988.
The overall accuracy before and after grouping ranges from 31 per cent to 78 per cent. The knowledge-based classification 1988 compared by land
Use 1988 yielded the lowest accuracy. Knowledge-based classification 1995 versus land use-cover 1995 shows the highest accuracy 78 per cent followed by maximum likelihood classification 76 per cent after grouping. Other overall accuracy after grouping does not exceed 70 per cent.
Conclusions
The knowledge- based classifications and maximum likelihood classifications of images 1988 and 1995 gave comparble means overall accuracy of 44 per cent. However, knowledge-based classification has advantage of quick classification and less field work than maximum likelihood classification.
By using remote sensing and GIS to analyses the nature, growth rate and location of land use changes, the central and local governments can identify cities and towns. They can formulate plans and policies to deal with such uncontrolled growth. The integration of remote sensing and GIS is a powerful tool and decision support system for urban growth management.
| Result from | Average Before grouping | accuracy after grouping | average Before grouping | reliability after grouping | overall Before grouping | accuracy after grouping | % improved |
| KBC95vsLU95 | 0.59 | 0.77 | 0.59 | 0.58 | 0.56 | 0.78 | 22 |
| MLH95vsLU95 | 0.38 | 0.54 | 0.35 | 0.56 | 0.46 | 0.66 | 26 |
| VI95vsLU95 | 0.53 | 0.52 | 0.41 | 0.54 | 0.51 | 0.62 | 11 |
| KBC88vsLU88 | 0.24 | 0.46 | 0.28 | 0.64 | 0.31 | 0.62 | 31 |
| MLH88vsLU88 | 0.34 | 0.77 | 0.29 | 0.75 | 0.54 | 0.76 | 22 |
| KBC95=knowledge-based for
image 95 MLH95 =maximum likelihood for image 95 KBC88=knowledge-based for image88 MLH88=maximum likelihood for image88 LU95=land use 95,VI95=visual interpretation LU88= LAND USE 88 | |||||||
Reference
- Bronsveld, K., Chutirattanapan, S., Pattanakakok, B., Suwanwerakamtom, R., and Trakooldit, P., 1994, The use of local knowledge in land use/land cover mapping from satellite images. ITC Journal, 4,349-358.
- De Bie, C.A., K. Beek, J, Driessen, P.M, Zinck, J.A, (1995):" Towards Operationalization of soil Information for Sustainable Land Management". Position Paper, Brazil soil Conference.
- Hutchinson, C.F (1982): " Techniques for Combining Landsat and Ancillary Data for Digital Classification improvement". Photogrammetric Engineeing and Remote Sensing, 48, pp 123-130.
- Jenssen L.L. F and H. Middelkoop (1992): "Knowledge-base crop classification of Landsat Thermatic Mapper image". International Journal Of Remote Sensing, 1992, Vol. 13.No.15, pp 2827-2837.
- Maniere, R., Poisson, M., and Lecharpentier, M., 1984, Land use mapping by remote sensing in theMediterranean region: Development of a software pakage for processing Landsat data. Proceeding of the Eighteenth Internation Symposium on Remote Sensing on Environment, Paris, 1-5 October (Ann Arbor, MI: ERIM), pp. 1937-1944.
- Peddle, D.R, and S.E. Franklin (1992): "Multisource Evidential Classificationo f Surface cover and Frozen Ground". International Journal of Remote Sensing 13(17), pp 3375-3380.
- Quarmby, N.A. (1989): " Monitoring urban land cover changes at the urban fringe from SPOT HRV imagery in south-east England". International Jouranl Remote Sensing, 1989, vol. 10.6, pp 953-963.
- Shafer, G., and Logan, R., 1987, Implementing Dempster's Rule of Hierarchical Evidance. Artifical Intelligence, 33 271-298.
- Srinivasan, A., and Richards, J.A., 1990, Knowledge-based techniques for multi-source classification. International Journal of Remote Sensing, 11, 505-525.