| GISdevelopment.net ---> AARS ---> ACRS 1997 ---> Global Environment |
Generating Global NPP Map for
Estimating Agricultural Productivity
Atsushi Hirakoba, Ryosuke
Shibasaki and Shiro Ochi
Murai-shibasaki lab., Institute of Industrial Science,
University of Tokyo
7-22-1 Roppongi Minato-ku Tokyo 106, Japan
Tel: (81)-3-3402-6231 Fax: (81)-3-3479-2762
E-mail:hirakoba@shunji.iis.u-tokyo.ac.jp
AbstractMurai-shibasaki lab., Institute of Industrial Science,
University of Tokyo
7-22-1 Roppongi Minato-ku Tokyo 106, Japan
Tel: (81)-3-3402-6231 Fax: (81)-3-3479-2762
E-mail:hirakoba@shunji.iis.u-tokyo.ac.jp
The world population are increasing year by year and are estimated to be 8300 million in 2025. Nowadays, there are a lot of arguments whether this Earth has the capacity to supply sufficient food to these drastically increasing population. We need objective materials to debate this kind of global problem and promote consensus for concrete actions.
In this study, we are going to estimate the world net primary productivity (NPP) using NDVI derived from NOAA AVHRR(8km) data and climate data (PAR) with "efficiency" approach (Monteith, 1972, 1977). This study will be followed by the estimation of agricultural productivity map.
Introduction
The world population are increasing year by year and are estimated to be 8300 million in 2025. This expansion of human activity brings pressure on global environment such as land degradation, resource exhaustion, global climate changes, and so on. One of them is due to food supply.
Thomas Rebert malthus, an English Economist, pointed out that "we may be perfectly certain, that the ratio of their increase in a limited territory must be of a totally different nature from the ratio of the ratio of the increase of population. A thousand millions are just as easily doubled every twenty-five years by the power of population as a thousand. But the food to support the increase from the greater number will by no means be obtained with the same facility." In his famous work "An Essay on Population". The relation between population increase and cereal population increase and cereal production from 1961-1995 wee shown in Figure 1. In spite of population increase, from 3100 million to 5700 million, serious food deficit has not occurred. That is because food production has increased more drastically.
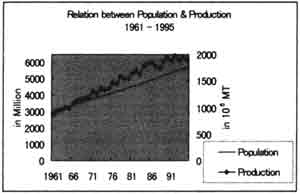
Figure 1: Relation between Population & Production 1961-1995 (Faostat, 1995)
Most of researches about food productivity are based on concept that same situation continue statistically but they don't consider clearly the limitation of water resources, land degradation, and so on. The final goal of this study is to estimate global food productivity using satellite data. In can be used to plan land use considering ground condition such as water resource limitation, land degradation and so on.
Methodology - Production Efficiency Approach-
In this study, we estimate NPP, which is the energy of biomass saved in dry organic. (Total amount of energy that plants produce minus the energy plants use during cellular respiration.) Accumulation of NPP - approximate of total biomass-in arable land must have strong correlation to crop production.
NPP estimation is based on "Production Efficiency Concept". This concept is first introduction by Monteith(1972). Monteith observed that plant production is correlated with the amount of photosynthetically action radiation (PAR) absorbed or intercepted by green foliage (APAR). Subsequently Monteith(1977) showed that plant production is approximately related to APPAR. This relation is summarized in equation below.
PAR is incoming photosynthetically active radiation (MJ/m2)
fAPAR is the fraction of PAR absorbed by canopy
fAPAR *PAR is APAR, canopy-absorbed incident solar radiation (MJ/m2)
e is conversion efficiency of APAR into organic dry matter (g/MJ)
Furthermore, several researchers showed the fraction of incident PAR absorbed by the canopy (fAPAR) cab be linearly related to the NDVI (Goward and Huemmrich (1992), Prince and Goward (1995)).
where, NDVI is normalized difference vegetation index.
| NDVI = | NIR-R ---------------- NIR + R |
NIR: surface reflectance's in the near-infrared wavelengths
R: surface reflectance's in the red wavelengths
The ratio has limit of -1 and +1. The higher NDVI is, the denser vegetation is.
Conversion efficiency of absorbed photosynthetically active radiation into primary production, e, is the variable introducing the greatest incertitude on the estimates. This is regarded as an empirical constant when it was first introduced (Monteith, 1972). Without climatic or other limitations, the upper limit was about 3.5 g/MJ. Hunt (1994) showed that the upper limit of e decreased to 2.0 g/MJ because of increased maintenance respiration with increasing woody biomass. e is constrained by environmental parameters, mainly air temperature, mainly air temperature, vapor pressure deficit, and soil moisture. Ruimy (1994) showed the variation of e according to vegetation. Production thus may be predicted from fAPAR -NDVI relation and the efficiency, e.
Analysis
Data
NDVI is derived from NOAA AVHRR (the Advanced Very High Resolution Radiometer) 8 km data set. The data is 10-days composite originally created from daily data and using Goode Homolosine projection. The orginal scaled digital NDVI (0-255 )
Geophysical NDVI=(digital NDVI-128)*0.008
PAR data set was provided by Prof.Dennis G.Dye (Dept. of Geography). Boston University) and was estimated by 370 nm reflectivity data from the Nimbis-7 Total Ozone Mapping Spectrometer (TOMS). (Dye et. al.,1993) the data set contains monthly PAR value [MJ/m2] and spatial coverage is 66N0 to 66S0 with a spatial resolution of 10 by 10.
Data Processing
1. Generating NDVI monthly composite
select the maximum value of NDVI 10 day composite of the same month (which is called the Maximum Value Composite, MVC), that is because lower values are considered to be measured when clouds cover the surface from the sun.
2. Transferring the NDVI data from Goode Homolosine projection to longitude/latitude projection. 3. Interpolation of the PAR data from 1 deg grid cell to 8 km grid cell
The resolution of PAR data is about 100 km. So interpolate it spatial and make 8 km resolution data set. The method of interpolation is bi-linear interpolation method using four neighboring points.
4.Calculation of fAPAR
In this study. we used the fAPAR -NDVI relationship equation:
which was derived from corrected and filtered NDVI with relatively high accuracy. (Ruimy,et al,1994)
5. Calculation of NPP
Use the formula below.
in this research, conversion efficiency is treated as constant, globally e =1.5[g/MJ] as shown by Goward et.al(1991).
Then, we will compare the accumulated NPP over each year to FAO production statistics. The procedure is also illustrated in Figure 2
Figure 2: Schematic Diagram of this study
Result
The global estimated NPP in Jan. and Jul.,1983 is shown in figure 3 and 4 Relatively higher values are measured in Southern Hemisphere in Jan, ans in Nothern Hemisphere in Jul.
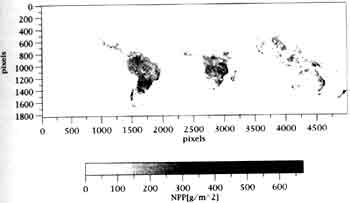
Figure 3: NPP Estimation Map for Jan., 1983
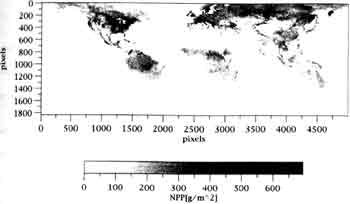
Figure 4: NPP Estimation Map for July, 1983
And the global annual estimated NPP is shown in figure 5. we can see the highest values in side of south America, that is because there is broad tropical forest.
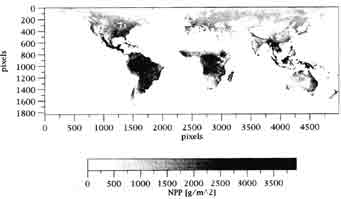
Figure 5 Annual NPP Estimation Map for 1983
Further Perspective
To estimate the relation between food productivity and accumulated NPP (A-NPP), we have to extract A-NPP in arable land. After that we will explore the model that explain the relation between productivity, A-NPP, precipitation, irrigation, fertilizer application and so on.
References
- Dye,D.,Goward, S and Eck (1993), T.Global Solar Radiation Data Set For Global Primary Studies, proceedings of SEIKEN SYMPOSIUM, 12 Global Environment from space,258-262.
- Goward, S.N. and hummrich, K.F(1992), Vegetation Canopy PAR Absorptance and the Normalized Difference vegetation Index; an assessment using SAIL model, remote sensing environment 39,119-140.
- Vegetation Index: An Assessment Using the SAIL Model, Remote Sensing of Environment 39,199-140.
- Measurement from the Advanced Very High Resolution Radiometer, Remote Sensing of Environment 35,257-277.
- Hunt, E.R. (1994) Relationship between woody biomass and PAR conversion efficiency for estimating net primary production from NDVI, International Journal of Remote Sensing 15(8) 1725-1730.
- Monteith, J.L. (1972) Solar Radiation and Productivity in Tropical Exosystems, Journal of Applied Ecology, 9, 747-766.
- Monteith, J.L. (1977) Climate and the efficiency of crop production in Britain, Philosphical transactions of the Royal Society of London. Ser. B, 281, 277-294.
- Prince, S.D., and Goward, S.N., (1995) Global primary production: a remote sensing approach, Journal of Biogeography 22, 815-835.
- Ruimy A., Saugier, B. and Dedier, G(1994) Methodology for the estimation of terrestrial net primary production from remotely sensed data, Journal of Geophysical Research, 99 3 5263-5283.