| GISdevelopment.net ---> AARS ---> ACRS 1997 ---> Global Environment |
ERS Wind Scattermeter Data
For Vegetation Monitoring In The Thar Desert
Haroon Stephen, Robert
Schumann, Volkmar, Kiyoshi Honda and Keaw Nualchawee
Space Technology: Application and Research Program,
Asian Institute Of Technology,
P.O.# Klong Luang 10120, Pathum Thani, Thailand.
Tel (66)-2-524-5579 Fax (66)-2-524-5596
E-mail:haroom@ait.ac.th
Abstract Space Technology: Application and Research Program,
Asian Institute Of Technology,
P.O.# Klong Luang 10120, Pathum Thani, Thailand.
Tel (66)-2-524-5579 Fax (66)-2-524-5596
E-mail:haroom@ait.ac.th
Since summer 1991 the Scattermeter aboard European Remote sensing satellite ERS-1 have provide global radar backscatter measurements of the Earth's surface. Over the oceans these data are used operationally for wind field retrieval and possible land applications have been under investigation. Due to the global coverage, the continuity of the data the wide range of incidence angle these data have been found to provide valuable information despite the coarse resolution. Furthermore, the day/night and all-wether operation capability enables data acquisition possible round the clock and under cloudy and rainy conditions. The geographical parameters of the land are reflected in the incidence angle diversity of the ERS Scattermeter. In this research we analyze normalized radar cross section (NRCS) measurement obtained over Thar Desert in Pakistan for the year 1994. Spatial variations in the radar cross section are compared with vegetation parameters obtained from AVHRR data. Seasonal as well as inter- annual variations are investigated by correlating the radar backscatter with NDVI data. Vegetation signatures from Scattermeter are analyzed which will help vegetation monitoring in the area which lack AVHRR data due to adverse wetland conditions.
Introduction
The first European Remote Sensing Satellite (ERS-1) WITH c-BAND (5.3 GHz) wind Scattermeter on board has been observing oceans for global wind measurements since July 1991. The launch of its sister ERS-2 in April 1995 enabled the uninterrupted supply of the global normalized radar cross section (NRCS) data to be continued towards the turn of the century. The ERS Scattermeter operator at vertical polarization (VV) and provides quasi-simultaneous views using three antenna which look 450 forward, perpendicular and 450 backward with respect to the satellite flight direction. The incidence angle varies from 250to590 for the fore-and aft-beam and from 180 to 470 for the mid-beam antenna. Different incidence angles and look directions provide enhanced geometric sensitivity of the backscatter measurements. The sensor illuminates a swath of 500 km wide to the right hand side of the satellite ground track. The data has an along track and cross track resolution of 50 km which is resample to a 25 km grid. Scattermeter acquisition is sun independent and is not hampered by clouds. The instrument achieves global coverage within 3-4 days (Wiseman, et.al.1996).
Thar desert is situated between 650-750E and 250-300 N. With a very low annual rainfall of less than 250 mm, it has a hot arid climate. Fig 1 shows the study area for this research, which lies at the border og\f Pakistan and India. In the west of the desert the river Indus with a wide patch of vegetation on both sides, and in the south of the desert is the coastal area of Arabian sea. Small amounts of unevenly distributed rains parts of the year cause vegetation changes which are cyclic in the nature. furthermore, the flucuations in the discharge of the river Indus passing through the desert also affect the semi desert part (Stephen, et.al1981).
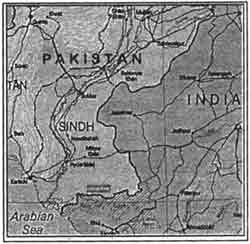
Figure 1: Map of study area
Data set
The investigations are made with following Available data:
Meteorological Data
Rainfall data for 16 ground stations in the study area from 1991 to 1995 was used which was collected from the Pakistan Meteorological Centers.
Radar backscatter data
Backscatter data of the study area is extracted from global NRCS data set distributed on CD-ROM by Center ERS archiving et de Treatment (CERSAT). Spatial radar backscatter maps of 45*40 pixels were prepared. Monthly averages of fore-beam radar backscatter for far range incidence angles (400-570).
Vegetation Cover Data
Atles of Pakistan (Survey of Pakistan,1981) and 12NOAA AVHRR images for the year 1994 were used to calculate Normalized Difference Vegetation Index (NDVI) for determination of vegetation cover variations in the study area. The NDVI data was resampled to a 25 km* 25 km grid scale by averaging the data within the cell in order to make it consistent with NRCS data.
Methodology
On the basis of NDVI variations in the area, the ground stations were categorized into following zones:
- Desert
- Semi Desert
- Vegetated area
- Mountains
Result
Radar backscatter variation with Rainfall
Figs. 2a, 2b and 2c show time series plots of radar backscatter and rain three point in the study area during January 1992 and May 1996. Rainfall data for the years 1992 and 1993 is not available and station in desert also lacks rainfall data for 1995. The rainy season in the area starts in the month of July and may go until end of September. It can be noticed that even slight rainfall affects the backscatter because it depends upon the dielectric constant which change with moisture conditions.
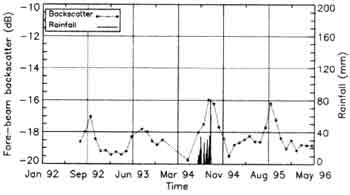
Figure 2a: Time Series of daily rainfall and monthly average radar backscatter of fore-beam and far range incidence angles for desert
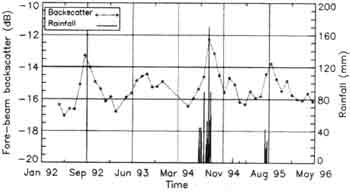
Figure 2b: Time Series of daily rainfall and monthly average radar backscatter of fore-beam and far range incidence angles for semi desert
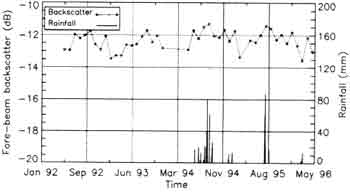
Figure 2c: Time Series of daily rainfall and monthly average radar backscatter of fore-beam and far range incidence angles for vegetated desert
Radar backscatter in the desert zone is as low as -19.5 dB due to the uniform land-form with very low vegetation and dry state of the soil, which causes also increases penetration and absorption of signal and increases specular reflection of microwave radiation. During the period from July to September rain an increase of -16 dB in radar backscatter.
The radar backscatter in the semi desert zone during the dry parts of the year retains its value around- 16 db during rainy season shows 4.5 dB increase mainly due to increased moisture and also due to increased vegetation density. The effect of rains reduces towards vegetated areas where it does not cause much variation in radar backscatter. The rise in rainy season for this area is about 1.5 dB.
Radar backscatter behavior of different zones
Fig.3 shows a map of spatial radar backscatter data for the July 1995 and the highest NRCS values are found in the mountains range. The radar backscatter in mountains ranges from -8 to -5 dB shown with red color and reduces towards the desert. The desert area can be seen as a dark purple colored patch and here the radar backscatter values lie between -22 and -17 dB. The low radar backscatter area is surrounded by a higher radar backscatter boundary of -16 to -13 dB which is actually an area with little vegetation cover.
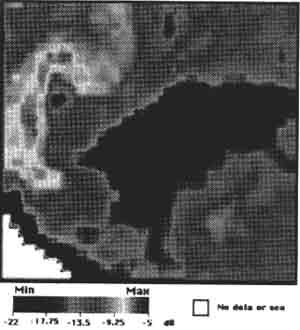
Figure 3: Map showing backscatter in different zones of the study area
The vegetation patch around the river can be seen in green color and has radar backscatter ranging between -13 and -10 dB. A small low radar backscatter patch in the north of Thar Desert beyond Indus river is part of Thal desert. It can be noticed that various landforms behave differently to Scattermeter, and indication for land studies on regional scale.
Radar backscatter time series and Howoeller diagram
Fig.4 shows the time series of the fore been and far range incidence angles radar backscatter images from March 1992 to October 1995. The cyclic radar backscatter behavior though different years can be well noticed. It is worth noting that the area with low radar backscatter which is actually the desert shrinks until September and again starts expanding to a maximum in May.
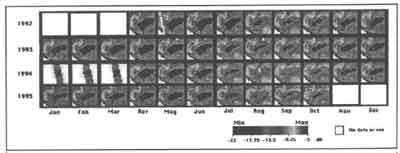
Figure 4: Time series of spatial radar backscatter for fore-beam and far range incidence angles.
The mountainous areas show expansion of high radar backscatter area twice a year i.e. in May- June and November-December, while minimum area of this radar backscatter (-8 to -5 dB) occurs in January and February. The patch around river shows the increased radar backscatter during August and September changing in color from green to yellow. During August-September the areas of low radar backscatter decrease while the areas of high radar backscatter increase throughout the time series. This increase in the radar backscatter corresponds to the rains occurring in the areas. Another worth noting phenomenon is the cyclic behavior of area throughout the study period. If same months of four years are compared, they show that beside inter- annual cycle the low radar backscatter area in desert is reducing from 1992 towards 1995. This could potentially be a part of a long duration cyclic behavior of the desert which may be investigated with sufficiently long term data of Scattermeter when available.
Fig.5 shows the Hovmoeller diagram for a slice through desert area from 220 N to 320 N latitude and 710 E longitude where inter-annual cyclic behavior and probable long term cycle can be seen. The southern parts are more susceptible to increase in radar backscatter in rainy season than the north. Vegetation in the north is mainly fed by river Indus which supplies water throughout the year while the south is rain area and shows greater variations in rainy season. Another noticeable feature is the time lag between different movements. In the south during 1992 the high radar backscatter area (blue colored) has a peak in August while for the still higher radar backscatter area (green colored), it is September with a lag of one month. Similar trends can be seen in other years except for 1993.
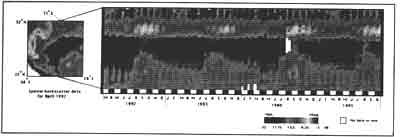
Figure 5: Rader backscatter hovmoveller diagram for a slice through desert area from 22 N to 32 N latitude and 71 E longitude
In each year if the shapes of the peaks are observed, it shows that th erise is drastic which is from July to September followed by a gradual fall until July of the next years. September 1994 slice shows maximum increase in backscatter which has been found to be the month of maximum rainfall in the study period.
Comparison with NDVI Hovemoeller diagram
Fig.6 shows vertical Hovmoeller diagram radar Backscatter and NDVI for year 1994. It is worth noting that the increase in radar backscatter during different months corresponds to the rise in NDVI values.
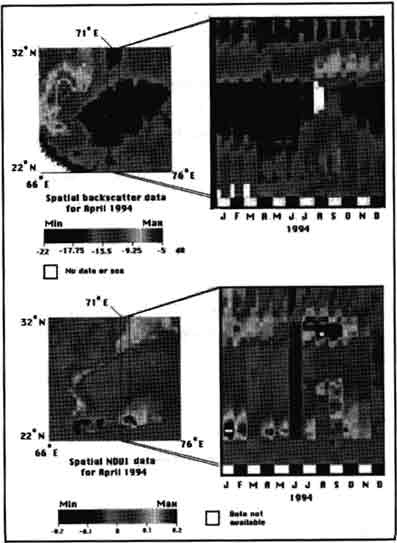
Figure 6: Comparison of NDVI and radar backscatter Hovemoveller diagrams for a slice through desert area from 22 N to 32 N latitude and 71 E longitude for the year 1994
This comparison of these colors in the diagrams show that they behave similarly in the diverse sets of the data. Not only the amount of in-suit variations correspond but the spatial movement the colors also are similar. The peak movement of NDVI from south to in rainy season corresponds to that in radar backscatter. The drastic rise and gradual decrease are also similar. The differences in the behavior of northern areas southern area are also similar. The time lag information cannot be seen in NDVI Hovmoeller diagram, this shows the potential of Scattermeter to reveal this information.
Conclusion
The potential of Scattermeter to study the geophysical and climatic parameters of Thar desert were investigated. The results showed that various landforms could be distinguished from their NRCS measurements. The radar backscatter has large dependence upon the vegetation density, which by itself is a function of climatic conditions. Hence there is a potential to use backscatter measurements to develop climatic model based vegetation behaviors in the area.
Acknowledgment
The author is grateful for the provided to conduct this research by:
- European Space Agency (ESA)
- Center ERS dArchivge et de Traitement (CERSAT)
- Government Of Japan
- Research Systems Incorporation (RS Inc.)
- Space and Upper Atmospheric Research Commission, Pakistan (SUPARCO)
- Pakistan meteorological center (PMC)
- Wiseman, V.; Cavanie, A.; Hoekman, D.; Woodhouse, I.; Boehnke, K.; Schmullius, C.; (1996), Land Surface Observation using the ERS-1 Windscatteromter, ESA Report No. 11103/94/NL/CN. Institute of Applied Remote Sensing, Wedel, Germany.pp.1-57.
- Stephen, H.; Schumann, R.; Honda. K.; Nualchawee, K.; (1997), Assessment of Scattermeter data for Environmental studies in the Thar Desert. Proc. IGARSS97, Singapore, August 4-8.pp.1829-1831.
- Survey of Pakistan (1981), Atlas of Pakistan, Survey of Pakistan, Muree road, Rawalpinidi, Pakistan.pp.51-54.
- ERS-1(1989), A new tool global environmental monitoring in 1990s, ESA 8-10, rue Mario-Nikis, 75738 paris CEDEX 15, France.pp.14-15.
- Boehnke,K.; Wismann, V.R.; (1996) ERS scatterometer land applications: Detecting soil thawing in Siberia. Earth onservation Quarterly n.52,pp.4-7.
- Wismann, V.R.; Boehnke K.; Schmullius, C.; (1995) Montiting ecological dynamics in Africa with the ERS-1 scatterometer. Proc. IGARSS'95, Firenze, Italy, Huly 10-14.
- Wagner, W.; Borgeaud, M; Noll, J.; 1996, Soil Mositure Mapping with the ERS Scatterometer, Earth Observation Quarterly n.54,pp.4-7.
- IFREMER;, CERSAT;, 1996, Off-line Wind Scatterometer ERS Products; User Manual, Ref: C2-MUT-W-01-1F, ver. 2.0, Department of Ocenography from Space, Plouzane.