| GISdevelopment.net ---> AARS ---> ACRS 1997 ---> Global Environment |
Simulation of Forest Cover
Map for 2025 and Beyond using Remote Sensing and GIS
Krishna Pahari, Shunji
Murai
Space Technology Applications and Research program
Asian Institute of Technology
Abstract Space Technology Applications and Research program
Asian Institute of Technology
Forest is one of the most important natural resources of the world, vital for sustaining the global environment including the human life. However, deforestation due to increased needs of the human population has been an issue of major concern for global environment. This study is an attempt to make predictions for the future state of global forest cover by first developing a correction model linking population with the forest loss and then making the spatial forest loss projections for the future based on the UN medium variant long term population projections.
Introduction
Human impact on global land cover change, especially in terms of change from forest cover to other land cover, has been one of the important issue on global change research. In the primitive times when there was little human population and low level of economic activity, deforestation was not a problem because the natural regeneration of forest was adequate to cover for any loss of forest by the human beings. However, with the advent of modern civilization and industrialization and the increase in population, the forest loss to meet the ever growing needs of the human population became so huge that it posed a problem for the global environment. Considering that loss of global forest has already become a matter of serious concern, it is important to make predictions on the state of forests in the future when the population is expected to reach almost 8 billion in 2025 and 9.40 billion in 2025.
Correlation Model Between Population Density and Forest Loss
Various researchers have conducted studies trying to relate the deforestation with factors such as population, GNP, external trade, land ownership, etc. However, it has been found that population has been the single most driving force to global deforestation. Out of various analyses carried out to establish the relationship between population and deforestation, the authors found that the correlation between the logarithm of the population density and the total accumulated forest loss is the most significant, with the correlation factor ranging from 0.71 to 0.91 for various regions of the world.
The total accumulated forest loss has been defined as the percentage area of forest loss to the current level of human impact compared to the potential natural land cover without the human impact. The potential natural land cover is defined as the land cover that potentially exists under given climatic conditions without the human impacts. Figure 1 shows the potential land cover based on climatic data, and Figure 2 shows the current land cover map for 1990, based on dynamic of NOAA GVI data (based on Murai and Honda, 1991). Figure 3 shows the correlation plots of logarithm of population density and total forest loss for different regions and Table 1 gives the summary of such correlation.
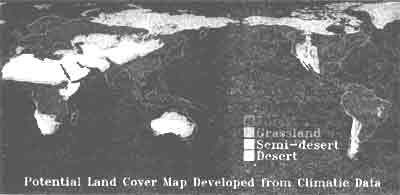
Figure 1: Potential natural land cover map developed from climatic data
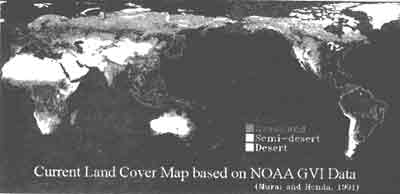
Figure 2: Current land cover map for 1990 from NOAA GVI data (based on Murai and Honda, 1991)
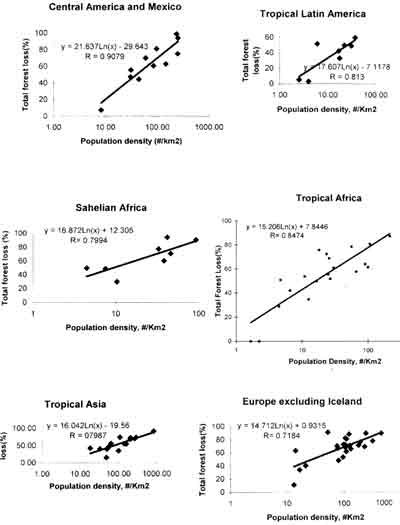
Figure 3: Correlation diagram between population density (logarithmic) and cumulative forest loss
| Region | Correlation function | R |
| Tropical Asia | 16.042In(x)-19.56 | 0.799 |
| Tropical Africa | 15.206 In(x)+7.8446 | 0.847 |
| Tropical South America | 17.607 In(x)-7.1178 | 0.813 |
| Sahelian Africa | 16.872 In(x)+12.305 | 0.799 |
| Central Africa | 21.063 In(x)-29.643 | 0.908 |
| Europe | 14.712 In(x)+0.9315 | 0.718 |
Predictions for Population and Forest Loss in 2025
Using the UN medium variant long range population projections, the correlation model was then used to make predictions for the forest loss for the future. The results of such a prediction based on the latest population predictions by the United nations (UN 1997) are summarized in Table 2.
| Population scenario | ||||
| Population (million) | ||||
| 1990 | 2025 | %gain | annual rate | |
| Tropical Asia | 1559 | 2650 | 70 | 1.527 |
| Tropical Latin America | 244 | 382 | 56.6 | 1.288 |
| Tropical Africa | 273 | 683 | 150 | 2.655 |
| Trop. Center America/Mexico | 135 | 217 | 60.7 | 1.372 |
| Total tropical | 2211 | 3953 | 78.79 | 1.674 |
| Sahelian Africa | 1278 | 326 | 156-7 | 2.73 |
| Europe (incl former USSR) | 761.7 | 761.8 | 0 | 0 |
| Forest scenario by regions | ||||
| Area('000ha) | ||||
| 1990 | 2025 | % loss | annual rate | |
| Tropical Asia | 294589 | 231931 | 21.27 | 0.68 |
| Tropical Latin America | 810831 | 685416 | 15.47 | 0.48 |
| Tropical Africa | 371006 | 255255 | 32.0 | 1.06 |
| Trop. Center America/Mexico | 79002 | 62802 | 20.50 | 0.65 |
| Total tropical | 1555428 | 1235404 | 20.57 | 0.66 |
| Sahelian Africa | 94663 | 66622 | 29.62 | 1.00 |
| Europe | 932355 | 929839 | 0.26 | 0.007 |
| Global forest loss | ||||
| 1990 | 2025 | Change | % of 1990 | |
| Forest | 33.2% | 29.8% | -3.4% | -10.2% |
| Grassland* | 34.7% | 48.1% | +3.4% | +9.80% |
| *Under the assumption that forest will change to grassland or agriculture | ||||
These predictions show that the deforestation is likely to continue at a very significant rate, especially in the developing countries. Among the countires in different groups, it is predicted that deforestation will be most severe in Africa, where is a predicted that more than 30% of the forests in 1990 will be lost by 2025, which corresponds to an annual deforestation rate of 1.06%. It can be noted that this is also the region where the population is likely to increase most rapidly. While most other regions will see some slowing in the speed of population growth compared to the decades before 1990, the case in Africa is different.
A spatial map of forest cover change (Figure 4) is then developed by using the following by using the following steps.

Figure 4: Map showing change in global forest cover from 1990 to 2025 (predicted)
- A spatial map for population density for 2025 is prepared by using the population data by CIESIN (1996) as the basis and then using the population growth for each country based on UN Population Projections
- Taking the values of total forest loss from 1990 to 2025 from the regression model for each country, the pixels of forest areas that correspond to higher values of population density are converted to grassland (under the assumption that deforested areas will change to grassland) such that number of forest pixels such converted is equal to the total forest loss for that country.
Using the same model and using medium variant long range population projections of the UN (UN 1996), an analysis for prediction of deforestation until 2025 showed that the deforestation slower. The results of prediction of are give in Table 3 and the corresponding rates of growth of population are given in Table 4.
| Average annual rate of deforestation (%) | |||
| 1990-2025 | 2025-2050 | 1990-2050 | |
| Tropical Asia | 0.68 | 0.39 | 0.56 |
| Tropical Latin America | 0.48 | 0.21 | 0.37 |
| Tropical Africa | 1.06 | 0.61 | 0.88 |
| Trop. Center America/Mexico | 0.65 | 0.39 | 0.54 |
| Total tropical | 0.66 | 0.33 | 0.52 |
| Sahelian Africa | 1.00 | 0.43 | 0.76 |
| Average annual rate of population growth (%) | |||
| 1990-2025 | 2025-2050 | 1990-2050 | |
| Tropical Asia | 1.527 | 0.497 | 1.097 |
| Tropical Latin America | 1.288 | 0.594 | 0.999 |
| Tropical Africa | 2.655 | 1.409 | 2.128 |
| Trop. Center America/Mexico | 1.372 | 0.757 | 1.099 |
| Total tropical | 1.674 | 0.694 | 1.254 |
| Sahelian Africa | 2.720 | 1.343 | 2.136 |
Conclusions and Further Studies
The results show that the problem of deforestation is likely to continue at a significant rate specially in the developing counties, and the problem is most severe in the case of Africa. Such a scenario of continuing deforestation is of serious concern from the point of global sustainability and thus calls for serious policy measures to address this problem, especially in developing countries.
The study demonstrated that Remote Sensing and GIS can be successfully used not only to map the current status of land cover but also to make predictions for future state of environment. Such a prediction for forest loss can be used to make predictions for a variety of environmental studies such as global land degradation, global carbon stock, etc. so as to provide early warning to the policy makers for a sustainable management of the earth environment.
Further studies are recommended using more refined global dataset and also to make studies on other aspects of environment related to global environment. More studies are also needed to make verification of the results.
Reference
- CIESIN (1996),Gridded Population Density of the World, Consortium for International. Earth Science Information network, Michigan, USA.
- MURAI, S. and Y. HONDA (1991), " World Vegetation map from NOAA GVI data" in S. Murai (ed). Applications of Remote Sensing in Asia and Oceania, Asian Association on Remote Sensing.
- UN (1996), World Population 1996. United Nations Population Division, Department for Economic and Social Information and Policy Analysis.
- UN (1997), The State of World Population 1997, United Nations Population fund.