| GISdevelopment.net ---> AARS ---> ACRS 1997 ---> GIS |
A Physical Evaluation of Land
Suitability for Rice : A Methodological Study using GIS*
C. Mongkolsawat P.
Thirangoon and P. Kuptawutinan
Computer Centre Khon Kaen University
Khon Kaen Thailand 40002
E-mail :charat@kku1.kkku.ac.th
Abstract
Computer Centre Khon Kaen University
Khon Kaen Thailand 40002
E-mail :charat@kku1.kkku.ac.th
The objectives of this study was to establish spatial model in land evaluation for rice using GIS. The study area, the lower Namphong watershed, covers an area of about 3000 sq. kms and is located in Northeast Thailand. The evaluation of land in terms of the suitability classes was based on the method as described in FAO guideline for land evaluation for rainfed agriculture. A land unit resulting from the overlay process of the selected theme layers has unique information of land qualities for which the suitability is based on. The selected them layers of rice include water availability, nutrient availability, landform, soil texture and salinization of soil. The theme layers were collected from existing information and satellite data. Analysis of rainfall data and irrigation area give the water availability. Spatial information of nutrient availability was formulated using soil map of Land Development Department. Landform of the area was prepared from Landsat TM. Soil texture and salinization of soil are based on the soil map. Each of the above mentioned layers with associated attribute data was digitally encoded in a GIS database to create thematic layers. Overlay operation on the layers produce a resultant polygonal layer, each of which is a land unit with characteristics of the land. Land suitability rating model applied to the resultant polygonal layer provided the suitability classes for rice. The resultant suitability class were checked against the rice yield which collected by the Department of Agriculture Extension. It was found to be satisfactory.
Introduction
Rice is an important export crop from Thailand. Rice crop area covers extensively or over 60% of the total cultivate land. A number of organizations are interested in the suitability area for rice so as to estimate the production. Systematic approach to produce information on the suitability is needed. The information can be separated into layers to model suitable area as a set condition. FAO guideline on the land evaluation system (1983) is widely used. They system was based on defined land qualities as related to landuse requirement.
Sys et al (1991) applied to the concept by FAO is assess the land in irrigated and rainfed area. Data on crop requirements are also provided (Sys et al 1993)
Bandibas .C (1995) developed an automated land evaluation system using the neural network based expert knowledge the method involved the transformation of the FAO land suitability classification expertise into trained artificial neural network.
In Thailand land classification activities have been conducted since the past two decades. Two land classification system are used: land capability for field crops and land suitability for rice. Land Development Department (LDD) began to adopt the land evaluation system developed by FAO for landuse planning in 1993. The map production is still used traditional method. Recently with the advent of satellite remote sensing and GIS a number of pilot projects were undertaken to test the capability of new technology. Sofar the spatial database of land resources has been established by digitally encoding the existing maps. There still needs to establish the modeling of land suitability for rice using computer based GIS. The objective of this study was to establish spatial model in land evaluation for rice using GIS.
The study area
The study area, the Lower Namphong watershed, is located in Northeast Thailand and covers an area of about 3,000 sq. kms. Geologically, the lower Namphong is formed by a thick sequence of Mesozoic sediment, the Korat Group ranging in age from upper Triassic to Tertiary. The main area is formed by flat to gently undulating alluvial plains which are drained by southeasterly flowing drainage system. Apart from the alluvial plains, the other prominent topography of the area is the low hill which lies in the upper part of the watershed. Paddy fields with scattered trees are common on the flat plain and low lying areas. Field crops are restricted to upper area with well drained soils. Isolated patches of forest remnant are found. Mean annual rainfall is about 1200 m.m.
Methodology
The process of evaluating the land in the upper Namphong is adopted the system developed by FAO (1983). The method to be proposed is intended to designed for assessing land for rice cultivation under the condition in Northeast Thailand. In the Northeast some land characteristics wit negligible difference within the region are not used for the evaluation. These are mostly climatic characteristics except the amount of rainfall. In order to develop a set of themes for evaluation and ultimately to produce a suitability map for rice, the crop requirement in terms of land qualities was reviewed (Sys et al 1993, LDD 1996, LDD 1990 and FAO 1983). Moreover, results obtained from experimental reports and regional experience were adopted to identify land quality as related to rice yield. The land qualities to be used in this evaluation thus include a number of land characteristics : Water Availability (W), Nutrient Availability Index (NAI), Water and Nutrient Retentions(R), Salt Hazard (S) and Topography (T)
Each land characteristics is considered as a thematic layer in the GIS. Determinations of the various factors and values assigned are summarized in the Table 1.
| Land quality | Diagnosti c Factor | Unit | Factor rating | |||||||||||||||
| 1.0 | 0.8 | 0.5 | 0.2 | 0.0 | ||||||||||||||
| Water Availability (W) | Rainfall/Irrigation | m.m. | >1800 or irrigated | 1200-1800 | 1200-900 | 900 | - | |||||||||||
| Nutrient Availability Index
(NAI) NAI= NN x P x K x pH |
N P K pH |
- % ppm meq/100g - |
>0.9 >0.5 >50 >0.5 6.0-7.5 |
0.04-0.09 0.5-0.08 25-50 0.2-0.5 5.5-6.0 |
0.02-0.4 0.08-0.4 10-25 0.1-0.2 4.5-5.5 |
<0.2 <0.4 <10 <0.1 <4.5 |
- - - - - - | |||||||||||
| Water and Nutrient Retentions (R) | Soil Texture/ Particle size |
SCL, SL, SC, CL L |
SL AC | LS, GS | SS | Rock Land | ||||||||||||
| ||||||||||||||||||
| Salt hazard (S) | Salinity of Soil | - | Non saline | Low saline | High saline | Vary high saline | - | |||||||||||
| Topography (T) | Landform and slope | - | F | LT/MT/M and slope <2.0% | LT/MT/M/L and slope 2-5% | MT/M/ and slope >5%, HT | - | |||||||||||
| F= Flood plain LT -= Low terrace MT = Middle terrace |
HT = High terrace M = Mountain L = Leave | |||||||||||||||||
The Water Availability was based on the amount of annual rainfall and availability of irrigation. The W-factor was generated from the spatial analysis of annual rainfall and irrigated area. The Nutrient Availability Index based on the method developed by Radcliffe et al (1982) and is given by NAI = N x P x K x pH. Spatial information on each diagnostic factor of NAI (N, P, K and pH) an be obtained from soil map of LDD. The water and Nutrient Retentions were estimated from the diagnostic of soil texture and particle size. Higher clay content results in high retention of water and available nutrients. Soil map provides information on soil texture and particle size. The soil salinity is a important edaphic constraints in the region. The availability of soil salinity map was used to assign factor rating. The diagnostic factor of topography (T) is a combination of landform and slope gradient. The landform and slope has predominant effect on the retentively of water during the growing period. Information on landform ad slope can be extracted from satellite imagery and topographic map (1:50,000) respectively.
Each of land qualities with associated attribute data are digitally encoded in a GIS database to eventually generate five thematic layers. The diagnostic factors of each thematic layer were assigned values of factor rating a identified in table 1. The evaluation model is defined using the value of factor rating as follows: Suitability = W x NAI x R x S x T. These five layer are then spatially overlaid to produce a resultant polygon layer. Application of the model to the resultant layer yields a suitability map with 4 classes according to the resultant values proposed in table 2.
| value | evaluation |
| 0.250-1.0 | Highly suitable (S1) |
| 0.100-0.250 | Moderately suitable (S2) |
| 0.100-0.25 | Marginally suitable (S3) |
| <0.025 | Unsuitable (N) |
Schematic chart of the spatial overlay showing the land characteristics and model is illustrated in figure 1.
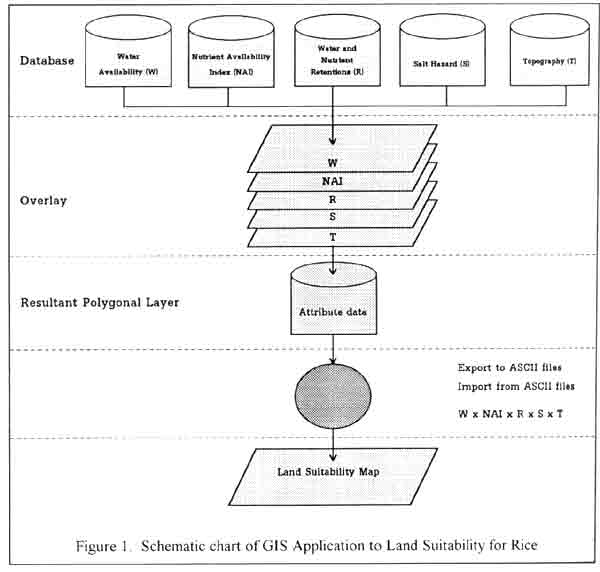
Figure 1. Schematic chart of GIS Application to Land Suitability for Rice
Results and discussion
The suitability map resulting from the spatial overlay of factors in the Lower Namphong Watershed is presented in figure 2. The area of suitability evolution is shown in table 3.
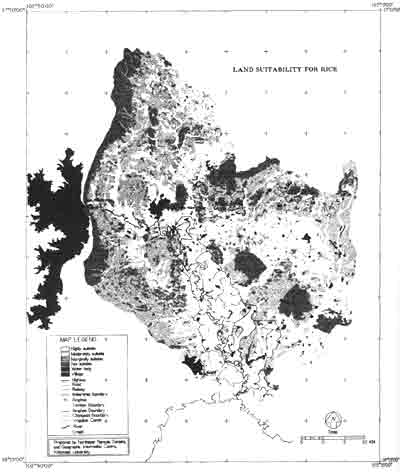
Figure 2. Land Suitability for Rice in the Lower Namphong Watershed, Northeast Thailand
| Suitability class | Area (km2) | % |
| Highly suitable | 208.30 | 6.97 |
| Moderately suitable | 868.26 | 29.03 |
| Marginally suitable | 1265.47 | 42.32 |
| Unsuitable | 530.27 | 17.73 |
| (Water body) | 36.63 | 1.23 |
| (Village) | 81.48 | 2.72 |
| Total | 2990.41 | 100 |
The study provides an approach to identify parametric values in modeling the land suitability for rice. The theme layers to be input in the modeling are assigned the rating value as attribute data. Overall insight into the factors affecting the suitability of land can be provided spatially and quantitatively. The result indicated that the highly suitable land cover an area of about 208.3 km2 and is restricted to the irrigated areas with high NAI. Some 17.73 percent of the watershed is unsuitable area for rice which corresponds to the sloping land. It has become increasingly apparent that computer based GIS and remote sensing data can provide the means to model land suitability effectively.
To assess the reliability of the methodology developed, the suitability classes were checked against the rice yield. The rice yields in he study area, were on average 4171.87, 2968.75 and 2078.12 kg/ha for the unit of class generated S1, S2 and S3 respectively. For moiré accurate results, average rice yields should be periodically collected, possibly 4-5 continues years. This will need further investigation to establish the resultant in relation to rice yield.
In conclusion, with analysis of spatial modeling it is possible to assess the land suitability with higher accuracy. In addition the modeling provided an approach to the improvement of rice yield by enhancing the component of modeling input.
Reference
- Bandibas D. J. 1995. An Automated Land Evaluation System Using Artificial Neural Network Based Expert's Knowledge. GIS and Remote Sensed Data. Asia-Pacific Remote Sensing Journal Vol. 8
- FAO 1983. Guidelines : Land Evaluation for Rainfed Agriculture Soils Bulletin No. 52 Rome: 237
- Land Development Department 1990 Land Evaluation for Economic crops. Min of Agriculture and cooperatives.
- Land Development Department 1996 Land Evaluation for Economic crops Min. of Agriculture and cooperatives.
- Land Development Department 1972. Detailed-Reconnaissance Soil Map (1:100, 000) Khon Kaen. Min of Agriculture and cooperatives..
- Land Development Department 1973a. Detailed-Reconnaissance Soil Map (1:100,000) Khon Kaen. Min of Agriculture and cooperatives.
- Land Development Department of 1973b. Detailed-Reconnaissance Soil Map (1:100,000) Maha Sarakham. Min of Agriculture and cooperatives.
- Department of Mineral Resources. 1981. Geological Map of Thailand (1:250,000) Min. of Industry.
- Department of Meteorology. 1991. Rainfall Statistics. Min. of Transportation.
- Department of Irrigation. 1989. Irrigated area in Nongwai, Namphong.
- Royal Thai Survey Department 1980. Topographic Map 1:50,000 Mapsheet No. 5541I, No. 55421-IV, No. 5543II, III No. 5641IIIV, No. 5642III, IV.
- Radcliffe D. J. and Rochette L. Maize in Angonia. An analysis of factors of production. Field Report 30, FAO/UNDP MOZ/75/011, Maputo.
- Sys. C., Ranst. V and Debaveye. J. 1991. Land Evaluation Part I, Part II Agricultural publication No. 7, ITC Ghent.
- Sys. C., Ranst. V, Debaveye J. and Beernaert. F. 1993. Land Evaluation Part III, crop requirements. Agr publication No. 7, ITC Ghent.