| GISdevelopment.net ---> AARS ---> ACRS 1997 ---> Geology |
Geomorphologic Distribution
of Normalized Difference Vegetation Index
Chi-Chung Lau
Water & Ocean Resource Div.,
Energy & Resource Lab., Itri
Bldg. 24, 195-6 Sec. 4, Chung Hsing Rd.,
Chiutung, Hsinchu, Taiwan 310, Republic of China
Tel: (886)-3-591-5468 Fax : (886)-3-582-0038
E-mail :f820027@erlb.erl.itri.org.tw
Abstract
Water & Ocean Resource Div.,
Energy & Resource Lab., Itri
Bldg. 24, 195-6 Sec. 4, Chung Hsing Rd.,
Chiutung, Hsinchu, Taiwan 310, Republic of China
Tel: (886)-3-591-5468 Fax : (886)-3-582-0038
E-mail :f820027@erlb.erl.itri.org.tw
Landsat/TM derived normalized difference vegetation index (NDVI) of for watersheds in Taiwan are used to studied their geomorphologic distribution. Raw data are corrected by Minnaert model to mitigate topographic effect. Results show that slope azimuth (aspect) is major factor affect distribution of NDVI. Inclined surface can be divided to illuminate and non-illuminate sides. The relatively low altitude area in watershed shows low NDVI values, and NDVI rapidly increases to 0.3-0.5 with elevation until 3000 meters. NDVI will decrees with elevation where above 3000 meters. Distributed of NDVI in where slope angle less 60 degree show a curve with a peak value occurring in slopes between 30-40 degrees.
Introduction
Topographic factors affect the vegetation pattern in different ways. Steep slope traps thin layer of soil which hold small amount of moisture, then resulting a low biomass. Aspects in illuminating orientation receive more solar radiometric energy than the aspects in shadowy side. Succeed results is abundant plants growing in there. Considering elevation, there is a common way to divide forest using altitude because it is a natural way for separating climate zone. Lin (1996, personal communication) found that the development of the plan community in Fusan experiment forest is significantly correlated with the altitude, topography, aspect and aspect-topography synthetic index.
Normalized different vegetation index (NDVI) derived by satellite remotely sensed data is a good data source to study the spatial distribution of biomass. The index comes from ratio of near-infrared (NIR) and red bands (RED):
This is the most commonly used vegetation index as it retains the ability to minimized topographic effects while producing a linear measurement scale. This property allows us a tool to see the detail of biomass distribution without topographic influence.
Test Sites
Four watersheds in different climate zones were selected to the area without many human activity (Fig.1). The selection was corresponded with a previous project which concern in hydrologic impact due to climate change. 1. Fusan basin located in northern Taiwan. Elevation ranges between 360m to 2130m. Climate zone being to GCWA and GCWB, warm-dry winter and humid summer. The warmest month has a lowest temperature of 22°C. Major plants are deciduous and bamboo, which can be divided into natural forest, secondary forest and grassland. 2. Chichiawan watershed is in alps of middle Taiwan with elevation from 1590m to 3890m. Major forest type is conifer and mixed-type forest. Climate zones are GCWB and GCWC, temperature can be lower than 10C in a short-cold summer. 3. Sandiman basin is in southern Taiwan, south of tropics, with elevation from 110m to 3060m. The climate zone belong to AW, GCWA, and GCWB, humid-warm weather. Rainfall occurred in summer and winter is dry. Major vegetation class is deciduous, conifers are appeared in high altitude area. 4. Lisan basin is in the steep mountain area in eastern Taiwan. Unlike other basin, orientation of major aspect is southeast-east direction. Elevation ranges from 200m to 3450m. Due to the steep terrain, climate zones are belong to AF, GCWA, GCWB, and GCWC, which change from a tropical area to cold-alps area.
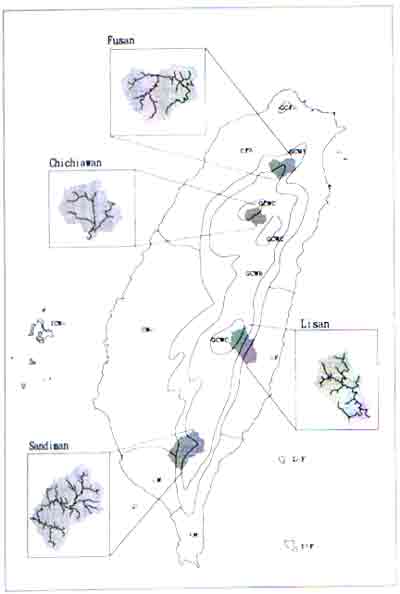
Figure 1: Study areas
Data Processes
Landsat 5/TM images acquired on January 9, 1995 at 9:.33 morning were used. Solar zenith angle of the scene was 58.36 and azimuth was 140.36. Original 30-meter-resolution data were rectified and resampled into 25 meter resolution, and were registered to Transverse Mercator (WGS84) projection. Whole data set is a 6000 x 8000-pixel matrix. Four watershed masks derived from Digital Terrain Model (DTM) is applied to extract data.
DTM of entire Taiwan island was produced by author in previous study which was developed by following steps: 1. An incomplete DTM data was collected from Taiwan Province Photogrammetric Service. 2. In the area lack of data, contour lines and labeling points were digitized every 50 meter room 1:5,0000, or 1:10,000 in mountain area, topographic maps. Vector data were converted to raster data by Kriging method using ARC/INFO software.
Once the DTM were prepared, topographic structure was extracted by a flow accumulation approach (Lau, 1993) that 1. created a pit-free DTM, 2. estimate flow direction, 3. calculate flow accumulation, and 4. define stream lines and basin mask. With the basin mask, only the pixels inside study basin were put in the analysis.
Mitigating the Topographic Effect
Scheneider and Robbins (1995) summarized methods to mitigates topographic effect: 1. Band rationing 2. Image Partitioning, 3. Direct illumination effect using a DTM and 4. Scattering Effects and non-Lambertain assumption. Band rationing similar the NDVI values used in this study. That can efficiency reduce the topographic effect and does not produce artificial variance in the output image. However, Some high relief areas and deeply shaded areas will be unimproved through band rationing.
In order to explore the NDVI distribution without the bias from scattering and diffuse light from inclined surface, images were processed using backwards radiance Correction transformation (BRCT) with Non-Lambertain assumption (Colby, 1991):
Where L = reflectance radiance, v = incidence angle, e = slope of the plane, Ln = radiance when v = e-0, k is the Minnaert constant. v can be calculated by Lambertain assumption:
where z is solar zenith angle and d is the angle between surface aspect and the solar azimuth angle. Minnaert constant k can be estimated from a regression expression which makes logarithm of he original equation: Y = a + k* X, where Y = Log[L * cos(e))], a = Log (Ln) and X = Log[cos(i)*cos(e)]. Original and correct NIR images of Fusan are shown in Fig. 2.
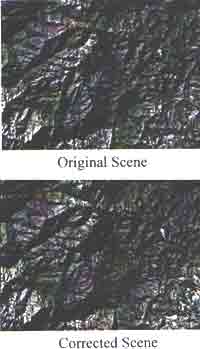
Figure 2: Near Infrared (Band 4) of Fusan Basin
Data Analysis
Influence of Aspect:
Comparing with the data of four basins, aspect shows a strong influence in controlling NDVI distribution (Fig. 3). The curves agree with Leprieur and Durand's study (1988) in which the maximum NDVI value happen in the solar orientation (about 140 degree) and a minimum opposite the sun.
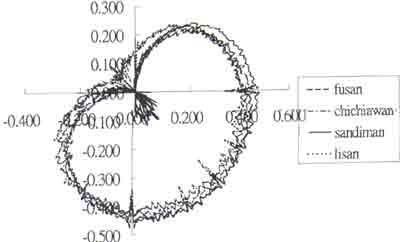
Figure 3: Didtribution of NDVI against the aspect
The trends of NDVI against slope and elevation do not show an obvious tendency. It may be induced by the strong influence of aspect. In order to eliminate the orientation effect, data were divided to illuminate and non-illuminate groups for further investigation. Illuminated group includes pixels located on aspect orientation between 50 to 230 degree, perpendicular to 140 degree in where the maximum NDVI occurred.
Influence of Slope :
In the illuminate side, NDVI has a smallest value in flat area and then rapidly increase in average value (0.3-0.5) (Fig. 4). The curve gradually change to a maximum value at about 40 degree. Above the point, different basin show diverse trends which may caused by the relatively small amount of data sample and local illumination. In the dark side, NDVI curve are still similar in all four basins but divides into tow branches in slope sleeper than 40 degree (Fig. 5).
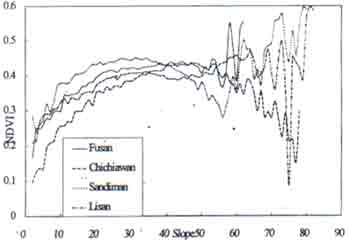
Figure 4: NDVI of illuminate aspect against slope
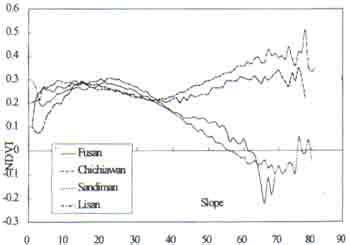
Figure 5: NDVI of non-illuminate aspect against slope
Change of NDVI against slope seems reasonable because of the solar radiance, solar types, and soil moisture and function of slope. Flat areas in valley bottom are always moist and shadowy, steep slope receive more solar energy but relative dry. Such conditions are harmful for vegetation growing.
Influence of Elevation (Fig. 6 and Fig. 7):
the pixels in low altitude always has low NDVI and rapidly rise to average values (0.3-0.5). Patterns are same in mountain basin or flat ground, and no difference in bright or dark orientation. It may comes from the reason as same as in flat slope area: pixels in relative low-altitude or flat-slope are usually stream outlet or valley bottom. These area have sufficient moisture but lack of solar radiation, which cause a low biomass and NDVI.
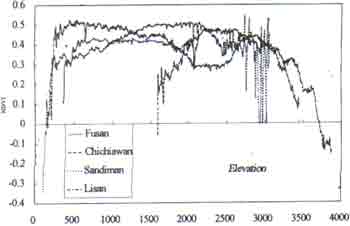
Figure 6: NDVI of illuminate aspect against elevation
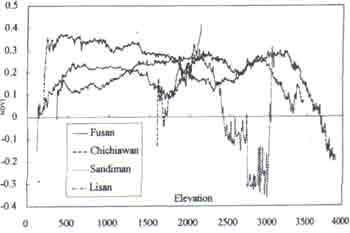
Figure 7: NDVI of non-illuminate aspect against elevation
The NDVI curves slowly decrease with elevation. Above the altitude of 3,000 meters, the trend rapidly decrease. IT shows that cooler temperature in higher elevation area turn down biomass, and the effect is much significant in elevation higher than 3000 meters.
Conclusion
This study combines remotely senses data and DTM to investigation the geomorphologic distribution pattern of NDVI. Data show that aspect is the most important factor. Separating data by illumination and non-illumination may be a simple but efficient way in classify the vegetation community.
NDVI distribution against slope and elevation shows the valley bottom and steep slope usually have less vegetation or lower biomass. Slopes in about 40 degree usually have largest value of NDVI. NDVI usually decrease with elevation. The decrease trend is gradual but drop very fast in the area about 3000 meters.
References
- Colby, J. D. (1991), "Topographic normalization in Rugged Terrain, " Photogrammetric Engineering and Remote Sensing, 57(5): 531-537.
- Dubreuil, P. L. (1986), "Review of Relationship between Geophysical Factors and Hydrological Characteristics in the Tropics, "Journal of Hydrology, 87:201-222.
- Lau, C. C. (1993), "Extracting Basin's Geomorphologic Factors Using Digital Terrain Model," in the Proceeding of 12-th Conference of Applied Survey, Chungil, Taiwan, pp627-638.
- Leprieur, C. E. and J. M. Durand (1988), "Influence of Topography on Forest Reflectances Using Landsat Thematic Mapper and Digital Terrain Data, " Photogrammetric Engineering and Remote Sensing, 54(4):491-496.
- Proy, C., D. Tanre and P. Y. Deschamps (1989), "Evaluation of Topographic Effect in Remotely Sensed Data," Remote Sensing Environment, 30:21-31.
- Schneider, K. and P. Robbins (1995), GIS Mountain Environments, United Nations Institute for Training and Research, Palais des Nations, CH-1211 Geneva 10, Switzerland. 180pp.