| GISdevelopment.net ---> AARS ---> ACRS 1997 ---> Geology |
Geological and Mineral
Prospecting in the Kuala Kelawang area using Remote Sensing and GIS
Tecniques
Azlikamil Napiah, Dr.
Nguyen Ngoc Thach, Adnan Hj. Ismail and Nik Nasruddin
Mahmood
Malaysian Centre for Remote Sensing (MACRES)
P. O. Box 208, Lot CB100, 5th Floor, City Square Centre,
Jalan Tun Razak 50400 Kuala Lumpur, Malaysia.
E-mail :azli@mail.macres.giv.my
Abstract
Malaysian Centre for Remote Sensing (MACRES)
P. O. Box 208, Lot CB100, 5th Floor, City Square Centre,
Jalan Tun Razak 50400 Kuala Lumpur, Malaysia.
E-mail :azli@mail.macres.giv.my
Kuala Kelawang area located at northwest of Negeri Sembilan Malaysia, exhibits various types of lithology and complicated landforms with complex tectonic settings. By using satellite data (Landsat TM), a lot more information can be extracted, especially for geological applications. Integration between remote sensing and GIS application was applied using ILWIS 1.4 software. Digital techniques used includes band composites, enhancement, band ratio, filtering and Principal Component Analysis. The techniques has produce some valuable products in comparison to the raw data. A number of geological features have been identified and separated into map product such as; rock type, lineament, structure, and others. Results of the study are useful for meteorological testing and geological referencing. In this project, suitable procedures of using remote sensing and GIS techniques for geological study has been established. However, further studies with field checks are necessary to improve the accuracy of each techniques.
Introduction
Malaysia and Vietnam have signed an agreement on scientific, technological and environmental co-operation on 15 December, 1993. Under this agreement remote sensing and related technologies have been identified, as a field of co-operation. This project was apart of information system (GIS). The objectives of this projects are;
- To establish a procedures of visual interpretation techniques in geology using satellite data.
- To generate a geological map, a geomorphological map, and a mineral prospecting map of Kuala Kelawang area in 1:100,000 scale.
- Materials
The study areas was chosen in the Kuala Kelawang, Negeri Sembilan. The study area consisted of an area of about 30 Km2 x 20 Km2. The area comprises about 1200km2 primary forest, hi[m1]lly to mountainous country and the rock formation ranges from Lower Paleozoic to Quaternary with different type of rocks; metamorphic, sedimentary and igneous.
Landsat TM (Thematic Mapper) digital spectral data taken on 2/4/94 (path/row 127/58) were used in this study. The scene of Landsat digital data were selected because of their small percentage of cloud cover and of their suitable time interval. A topographic map sheet number 95 at scale 1:63,360 were used as based and reference map, respectively. This is to support the satellite imageries. These were also used to aid in ground truthing - visual analysis and interpretation. The MicroVax system. Meridian version 5.2 and IL WIS version 1.4 was used in this study. The MicroVax system was used for loading the satellite data from CCT tape which was supply by NRCT, Thailand. The Meridian software was applied in the geocoding process of satellite data, while the ILWIS (Integrated Land and Water Information System) was used especially for further digital analysis, processing and classification of satellite imagery.
- Methodology
In order to improve the information form the imagery, both of digital processing and visual interpretation has been applied. The procedures followed in this study are shown as below (figure 1);
Figure 1: Methodology flow chart
Result and Discussion
In the primary forest covered area such as Kuala Kelawang areas, conclusion of geological stud and digital processing techniques can be combined with visual interpretation and GIS. Each technique of digital processing will give some separated information. Band Composite imagery with selected bands and difference color (357 and 457) and filtering techniques is useful to enhance the lithological unit and tectonic features. Principal Components is also useful for delineate lineament (PC1) and lithological unit (PC3, PC4). With difference data from digital process, the visual interpretation brought out more detail information compare to the result from one kind of image. The correlation matrix between bands of Landsat TM (especially bands 4, 5, 7) was also used to minimize the differents of digital counts in each band which related to the same physical units.
In the digital processing methods, most of the spectral images have shown their own distinctive feature of geological structure in the study area. For example of B1/B3 displayed more detail of alluvial formation along the rive system. Whereas image of B3/B7, the different between granite Telemong and Paleozoic Sandstone can be delineated into contour line based on the processing of different band and band ratio the DN value of rock types have been identified as shown in Table 1. In the study area, except the basin area, the raw data or even after stretching process, the imagery has show most of the hilly and mountain area was fully covered by tropical forest. Spectral characteristic of rock has been identified by vegetable reflectance using filtering technique, and a number of lineament has been enhanced. Result of filtering technique shows mainly five generation of lineament which has been distinguished using edge enhancement, Laplacian filter, Suvillivar filter, and Bernsteia filter (3x3) with different direction).
| G5mf | G5C | G(1,2,3,4) | P2 | C | S-D | Q | W | ||
| B1 | 255 | 64 | 64 | 67 | 72 | 67 | 69 | 90 | 70 |
| B2 | 133 | 24 | 23 | 26 | 32 | 27 | 29 | 70 | 41 |
| B3 | 250 | 26 | 24 | 22 | 38 | 26 | 48 | 67 | 50 |
| B4 | 153 | 85 | 98 | 93 | 83 | 90 | 82 | 110 | 14 |
| B5 | 243 | 50 | 76 | 53 | 53 | 12 | 79 | 96 | 15 |
| B7 | 131 | 8 | 14 | 9 | 23 | 20 | 27 | 50 | 3 |
| B1/B2 | 1.92 | 2.67 | 2.78 | 2.35 | 2.25 | 2.48 | 2.40 | 1.29 | 1.71 |
| B1/ B3 | 1.02 | 2.46 | 2.46 | 2.78 | 1.89 | 2.58 | 1.44 | 1.34 | 1.40 |
| B1/ B7 | 1.95 | 8.00 | 4.57 | 6.78 | 3.13 | 3.35 | 2.56 | 1.80 | 2.30 |
| B2/ B3 | 0.53 | 0.92 | 0.95 | 1.18 | 0.84 | 1.03 | 0.60 | 1.04 | 0.80 |
| B2/ B4 | 0.87 | 0.24 | 0.23 | 0.28 | 0.38 | 0.30 | 0.35 | 0.64 | 2.93 |
| B2/ B5 | 0.55 | 0.48 | 0.30 | 0.49 | 0.60 | 0.38 | 0.37 | 0.73 | 2.73 |
| B2/ B7 | 1.02 | 3.00 | 1.64 | 2.89 | 1.39 | 1.35 | 1.07 | 1.80 | 13.7 |
| B3/ B4 | 1.63 | 0.31 | 0.24 | 0.24 | 0.46 | 0.36 | 1.14 | 0.61 | 3.57 |
| B3/ B5 | 1.03 | 0.52 | 0.32 | 0.41 | 0.72 | 0.36 | 0.60 | 0.70 | 33 |
| B3/ B7 | 1.90 | 3.25 | 1.17 | 2.40 | 1.65 | 1.30 | 1.78 | 2.20 | 4.67 |
| B5/ B1 | 0.95 | 0.78 | 1.18 | 0.87 | 0.74 | 1.07 | 1.14 | 1.07 | 0.21 |
| B5/ B2 | 1.83 | 2.08 | 3.30 | 201 | 1.65 | 2.67 | 2.72 | 1.37 | 0.36 |
| B5/ B3 | 0.97 | 1.12 | 3.16 | 2.41 | 1.39 | 2.77 | 1.65 | 1.43 | 0.30 |
| B5/ B7 | 1.85 | 6.25 | 5.42 | 0.57 | 2.30 | 3.60 | 1.44 | 1.92 | 5.00 |
| B4/ B5 | 0.63 | 1.70 | 1.29 | 1.75 | 1.57 | 1.25 | 1.04 | 1.14 | 0.93 |
| B4/ B7 | 1.17 | 10.63 | 7.00 | 10.33 | 3.60 | 4.50 | 3.04 | 2.20 | 4.67 |
| B4/ B1 | 0.60 | 1.33 | 1.53 | 1.52 | 1.15 | 1.34 | 1.19 | 1.22 | 0.20 |
| B7/ B3 | 0.52 | 0.3 | 0.58 | 0.41 | 0.60 | 0.77 | 0.56 | 0.75 | 006 |
| B7/ B4 | 0.86 | 0.09 | 0.14 | 0.10 | 0.28 | 0.22 | 0.33 | 0.45 | 0.21 |
| B7/ B5 | 0.54 | 0.16 | 0.18 | 0.17 | 2.30 | 3.60 | 2.90 | 0.52 | 0.20 |
| B1/ B5 | 1.05 | 1.28 | 0.84 | 1.15 | 1.36 | 0.93 | 0.87 | 0.94 | 4.67 |
The main direction of lineament are Northeast-Southeast, North-South, Northeast-Southwest and East-West. The Northwest-Southeast is the earlier than Northeast-Southwest direction. High frequency filtering is used because it is a suitable technique for differentiate the boundary of several coarse and medium grained Granitic Zones, which also concerning the different of crystallization of biotite, muscovite, amphybolite, and tourmaline; especially in Bentong Granite distribution. Circular structure has been clearly delineated in the edge enhancement imageries and in the contrast enhancement image. Small circular structures with diameter ranging from 1-2 km are closely related to the mineral concentration position in the Semenyih Granitoid (G4) and Broga Granite (G2) (Shu, 1989). In the principal component analysis part, the eigen vector is changed due to the spectral of rock types in different wavelength on the image of PC1, PC2, PC3, PC4. Through this method, the rock type can be recognized although it still have some difficulty, except the quaternary formation type. While, the techniques of visual interpretation based on photographic element and geotechnical element can strongly support to establishment of interpretation keys to lithological units (Table 2), for tectonic features (fault, fold and lineament) and also for geomorphological units.
The integrated assessment method has been used to generate a mineral prospecting zones. As a guidance, the parameters, such as condition of mineral foundation (rock type, structure, landform), geochemical mechanism of each kind of ore (especially heavy mineral), and dynamic condition for the mineral were used in both remote sensing and GIS analysis.
Conclusion
By using the satellite data together with ancillary data and remote sensing and GIS techniques; four map has been generated ; the geological map, the geomorphological map, and the mineral prospecting map of Kuala Kelawang, Jelebu, Negeri Sembilan in 1:100, 000 scale (Figure 2 and 3). Based on the primarily finding, several suitable techniques for geological study using remote sensing and GIS technique has been identify and propose;
- RI = (b7-b2)/b7+b2) together with image maps calculation formula; (B7-B5) + 100 is the suitable rock index for enhance some lithological units.
- The best band ratio for geological study are; 7/3, 5/4, 4/7, and 5/2.
- The composites of bands; 523, 754, 753, 457, 4/5+5/6+6/7, 5/4+7/4+3/7, and B4+B7 is the most useful of band composites in RGB for geological applications.
- In the principle components processing; only PC1 (with 75% of eigen value) gave the best result for general aspect of geology while PC2 and PC3 (with 25% of eigen value ) only can enhance some geological features.
- The low pass filtering (including smoothing techniques) can remove a noise and enhance the lithological units, but for non linear-high filter are not so useful for lithological distinguish but can enhance some geomorphological unit such as valley fill, river delta, etc.
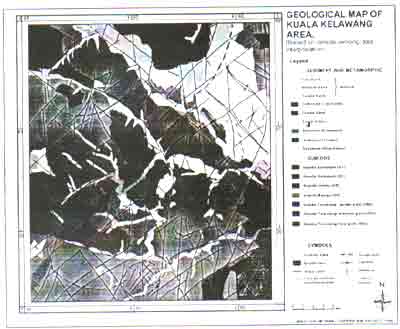
Figure 2: Geological map of Kuala Kelawang
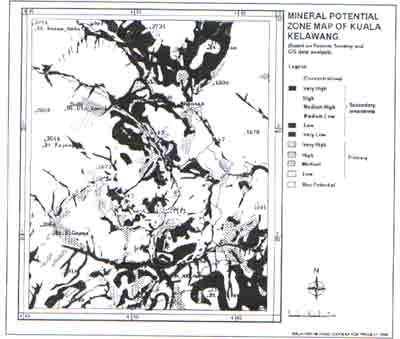
Figure 3: Mineral potential zone map of Kuala Kelawang
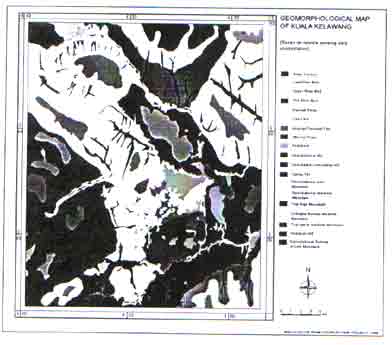
Figure 4: Geomorphological map of Kuala Kelawang.
References
- SCHOURENGERDT, R.A., 1983. Techniques for Image Processing and Classification in Remote Sensing, 178 p.
- DRURI, S.A., 1994. Image Interpretation in Geology, Second Edition. 302 p.
- SABIN, 1995. Special Issue: Geologic Remote Sensing, Principle and Interpretation. Environment Remote Sensing First edition. 210 p.
- SHU, Y. K., 1989. The Geology and Mineral resources of the Kuala Kelawang Area, Jelebu Negeri Sembilan Geological Survey of Malaysia, Disrict Memoir 20. 208 p.
- MURAI, S., 1995. Remote Sensing Note, Japan Remote Sensing Association (RESTEC).
- THORNBURY, W.D., 1969, Principles of Geomorphology, second edition, New York, Wiley, 311 p.
- TJIA, H.D., 1973, Geomorphology. In Geology of Malay Peninsula, D. J. Gobbett & C. S. Hutchison (editor), New York, Wiley, 13-24.