| GISdevelopment.net ---> AARS ---> ACRS 1997 ---> Forestry |
Biophysical Spectral Response
Modeling Approach for Forest Density Stratification
P.S. Roy, S. Miyatake* and
A. Rikimaru*
Indian Institute of Remote Sensing, (NRSA),
Department of Space, Dehra Dun- 248001, India
Tel: (91) -135 - 744518 Fax : (91)
E-mail: psroy@del2.vsnal.net.in
*Japan Overseas Forestry Consultants Association
Rinyuu-Blgd : 1-7-12 Koraku, Bunkyo-Ku, Tokyo, Japan
Tel: 81-3-5689-3435 Fax : 81-3-5689-3439
E-mail: Jofca@-web.or.jp
Abstract Indian Institute of Remote Sensing, (NRSA),
Department of Space, Dehra Dun- 248001, India
Tel: (91) -135 - 744518 Fax : (91)
E-mail: psroy@del2.vsnal.net.in
*Japan Overseas Forestry Consultants Association
Rinyuu-Blgd : 1-7-12 Koraku, Bunkyo-Ku, Tokyo, Japan
Tel: 81-3-5689-3435 Fax : 81-3-5689-3439
E-mail: Jofca@-web.or.jp
The present paper suggests biophysical spectral response modeling approach using a three way crown density stratification utilizing advanced vegetation index, bare soil index, shadow index and temperature for the classification of forest crown density in two different study sites viz., evergreen forests of Andaman and dry deciduous forest of central India. The present study is part of field test of International Tropical Tmber Organization (ITTO) and Japan Overseas Forestry Consultants Association (JOFCA) project on Rehabilitation of logged over forest in Asia/Pacific region (PD 32/93 Rev 2 (F)).
1. Introduction
Satellite remote sensing provides a mean to obtain a synoptic view of forest and their condition on real time basis. The standardization of ground sampling methods, understanding of spectral and temporal responses of vegetation, coupled with the recent advancements in the digital image processing techniques have brought about a profound acceptance of the application of satellite remote sensing data in forest inventory and mapping (Malingreau, 1991). Forest density expressing the stocking status constitutes the single major stand physiognomic characteristic of the forest. Satellite remote sensing provides a measure of the canopy closure. The percent crown closure is a measure of area occupation rather than stand density. However, it is an important parameter used to stratify the forests. Ver few attempts have been reported to stratify the forest density using satellite remote sensing digital data (Roy et al. 1990).
International Tropical Timber Organisation (ITTO) and Japan Overseas Forestry Consultants Association (JOFCA) while working on project entitled Utilization of Remote developed a methodology wherein biophysical spectral indices were developed to stratify forest density (Anon., 1993 and Rikimaru, 1996). In the present study the methodology has been validated in two different Indian sites viz, evergreen forests of Andaman and dry deciduous forest of central region.
2. Study area
Two study sites having different forest types, structure and undergrowth conditions have been selected for the present study.
2.1 Test area in Evergreen forests
South Andaman Forest Division situated in Andaman islands is one of the test area. The terrain of the area is irregular and undulating. The main hill range runs through north and south, however, minor ridges run in all directions. The slope ranges from steep to moderate. The climate is wet tropical and is characterized by high rainfall (2750-3400 mm), high relative humidity (63-91%) and equable temperature (21-33oC). The forests are mainly of Andaman tropical evergreen forest, Andaman semi evergreen forest, Andaman moist deciduous forest, Tidal mangrove forest and Bamboo brakes (Champion and Seth, 1968).
2.2 Test area in Dry deciduous forests
Shivpuri is the second test site for the present study. It is located in central India occupying the Vindhyan landscape. The climate of the area is hot and dry. It is classified under semi-arid to arid region. The annual rainfall is 895.5 mm. The relative constitutes low hills, plateau and plains, mostly of the upper Vindhyan. The elevation varies between 250 m to 510 m above msl topography. The forests are mainly of northern tropical dry and moist deciduous forest (Champion and Seth 1968).
3 Materials and methods
3.1 Data used
Landsat Thematic Mapper data (Path-Row 134-052) of March 1984 has been used for the digital analysis of evergreen forests of South Andaman Forest Division. The aerial photographs of 1:64,000 scale of December 1968 were also used during ground data collection. The stratified random sampling approach has been the basis of distributing sample points in the study area. Thirty sample plots of 0.1 ha. Size have been selected in various forest cover types of the study area. The total enumeration was done in the sample plots, for parameters like, crown density, height (stratwise), number of trees/species, and basal areas were measured.
Landsat Thematic Mapper (TM) data (path-Row 146-042 ) of January 1990 has been used for the digital analysis of dry deciduous forest stock maps prepared by the state forest departments have been used as reference.
3.2 Methodology
The digital image processing for evergreen forests of South Andaman Forest Division has been done using PC based MAI (Modular GIS Advanced Imager) of Intergraph package on Windows NT. The Landsat TM bands TM bands (except bands 6) were normalized using linear transformation. The temperature calibration using coefficients for Landsat 5 was done to estimate ground temperature. The temperature data has only been used to separate soil and non-tree shadow. The colour images produced from Landsat TM raw bands 4,3,2 and 5,4,3 provide valuable information on the forest cover type distribution.
The digital image processing for dry deciduous forests of central India has been performed on IBM RS-6000 series using EASI PACE software. The spectral dataset is subjected to physical transformation using enhancement techniques. Attempts have been made to isolate vegetation cover, soil background influence and canopy shadow been made to isolate vegetation cover, soil background influence and canopy shadow pattern from Landsat TM data. The vegetation feature space data was stratified based on the 'texture' of the data as influenced by the canopy shadow. Finally a rule based logic is implemented to achieve land cover and forest density classification. In both the case the results have been improved by using water mask from Landsat TM band7.
The process and steps involved in calculating Biophysical Spectral Indices are given as below (Anon., 1993 and Rikimaru, 1996):
3.3 Normalisation of Landsat TM Bands
The Landsat TM bands (ecept band 6) were normalized using linear transformation (equations 1 and 2)
| a | = (Y1-Y2)/ (X1-X2) |
| = (20-220) / {m-2s) - (m +2s)} …………………….eq. 1 | |
| = 50/s | |
| X1 = m-2s X2 = m+2s | |
| Y1 = 20 Y2 = 220 | |
| B = -ax1 +y1 or Y= aX +b ……eq. 2 | |
Y will normalize the Landsat TM band and X is the original Landsat data.
3.4 Temperature calibration
The normalization operation is not conducted for band 6 due to treatment of temperature calibration. The temperature calibration of the thermal infrared band into the value of ground temperature has been done using equation 3 and 4. The calibration coefficients used for the study are as per Pat, 1989.
| L = L min + ((L max-Lmin)/255) x Q ………….. eq. 3 |
| L: value of radiance in thermal infared |
| Q: digital record |
| L max: value of radiance = 1.500 mw/cm2/str(Q=0) |
| L min : value of radiance = 0.1238 mw/cm2/str (Q=255) |
| T = A2/in (Al /L +1) |
| T: ground temperature (k) |
3.5 Advanced vegetation index
NDVI is unable to highlight subtle differences in canopy density. It has been found to improve by using power degree of the infrared response. The index thus calculated has been termed as advanced vegetation index (AVI). It has been more sensitive to forest density and physiognomic vegetation classes. AVI has been calculated using equation 5.
| AVI = {(B4 +1) x (256-B3) x B4/3]1/3 …………..eq. 5 |
| B43=B4-B3 |
| IF (B43.LT.O) GO TO f: if B4<B3 after normalization, f AVI = 0 |
3.6 Bar soil index
The bare soil areas, fallow lands, vegetation with marked background response are enhanced using this index. Similar to the concept of AVI, the bare soil index (BI) is a normalized index of the difference sums of two separating the vegetation with different background viz. completely bare, sparse canopy and dense canopy etc. BI has been calculated using equation 6 and 7.
| BI = BIO x 100 +100 …………………………………… eq. 6 |
| BIO = {(B5 +B3) ((B4 + B1)(/((B5 +B3) + (B4+B1)}. Eq. 7 |
3.7 Canopy shadow Index
The crown arrangement in the forest stand leads to shadow pattern affecting the spectral responses. The young even aged stands have low canopy shadow index (SI) compared to the mature natural forest stands. The later forest stands show flat and low spectral axis in comparison to that of the open area. SI has been calculated using equation 8.
Canopy shadow index has been further improved by calculating logarithmic amplification of canopy shadow index. The index has been calculated using equation 9.
| SIL = {(256-BL1) X (256 - BL2) x (256 -BL3)}1/3 ………….eq. 9 |
| BLI = 100 x Log (B1-B1 min +1) |
| BL2 = 100 x Log (B2-B2 min +1) |
| BL3 = 100 x Log (B3-B3 min +1) |
The maximum value of SI within the 3 x 3 spatial filter is incorporated into the central cell of the filter to calculate the textured advance shadow index (ASIO)
| AIO = Max (SI1, SI2,SI3, SI4, SIO, SI5, SI6, SI7, SI8) …eq. 10 | |
| IF (AVIO.LT.THV) ASIO=0: | If the AVI value is lower than the standard value, it is not recognized as forest shadow, It may be a gap in the forest canopy. |
| IF (TO.T.THT) ASIO=0: | If the ground temperature is higher than the standard value, is not recognized as forest shadow. |
3.8 Classification
Two methods have been followed to achieve the classification of forest type and density. In the first approach forest density stratification has been achieved using three way model using AVI, BI and SI. In the second approach the rule -based approach has been followed wherein the AVI, BI and SI database has been subjected to clustering. The clusters have been reclassed using the ground truth data to label them. The density classes are presented along with the forest type and their succession stages for information completeness. The hybrid classification approach (combination of unsupervised and supervised) has been used for classifying forest types. Keeping forest type map in the background the forest density map has been reclassified using logical operator to prepare final forest type and density map.
4. Results and discussion
Satellite remote sensing data have been used to identify vegetation cover and their density (Wu et al. 1995; Roy et al. 1990; McCloy and Hall 1991). The biophysical indices can reduce the effect of bias and assist in the extraction of significant features of a specified ground object (Curran, 1980). These indices also help in categorizing 'mixed pixel' effectively (McCloy and Hall 1991). The present study proposes a set of vegetation indices using linear combinations to isolate vegetation cover characteristics which vary with canopy density. The present approach has been found to be fairly robust and able to provide acceptable accuracy.
4.1 Test area in Evergreen forests
The spectral characteristics of different forest types were analyzed from thirty different sample plots. The average spectral response clearly indicates that the signatures markedly vary. The classifications of forest type and density have been based on these signatures. AVI, BI and SI have been used for preparing combination images and classification. The colour composites using Landsat TM bands and index have been used to highlight forest and density.
Majority of the forests in the study area have canopy closure of 40% to 80%. The density levels could be separated using the present methodology. These density classes are forest> 80%, forest 60-80%, forest 40-60%, mangrove>80%, plantation/regrowth and non-forest/agriculture. The vegetation type classification preformed by using hybrid (unsupervised and supervised) approach has been combined using logical operator (Fig1). The classification accuracy has been evaluated using stratified random sampling approach. The sample point(n=68) have been distributed in the different forest types (inclusive of density). The results (at 95% confidence limit) indicate that the overall mapping accuracy has been 91.4% and 88.2%. Highest accuracy has been observed in the case of evergreen forests of >80% density. Lowest accuracy has been observed in the case of mangrove forest on old tidal flats.
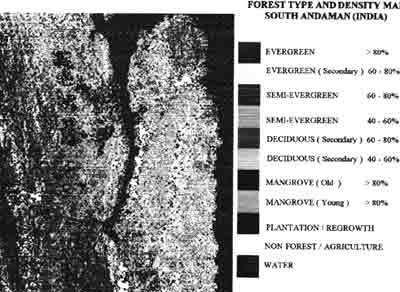
Fig. 1 Classification using Biophysical Spectral Response Model
4.2 Test area in dry deciduous forests
The present approach provided five forest density classes (>80%, 60-80%, 40-60%,20-40% and10-20%) and physiognomic classes like scrub/shrub and grassland. The hierarchical approach of identifying different Landover features and forest density was compiled into seta of rules, which are implemented for the classification results have been compared with permanent sample points (0.1 ha) marked on forest thematic maps. For evaluating classification two maps used are: (i) Landover and forest density classified map, (ii) broad landover classified map (without forest density stratification). The overall accuracy of the generalized landover map has been observed as 91.5%. The accuracy of first three density categories (viz.>80%, 60-80% and 40-60%) has been found to range between 93- 95%. The accuracy of the remaining density classes (viz, 20-40% and 10-20%) ranged between 82-85%. The overall classification accuracy of the map showing landover type and forest density is 89.4%.
The approach has been, so far validated in the dry deciduous forests and evergreen forest of Andaman only. Its extension in other biolimatic conditions need to be tested before terming it a robust methodology. The method may also need suitable adjustments in different vegetation types and terrain conditions.
Reference
- Anoaymous 1993, Rehabilitation of logged over Forests in Asia/Pacific region. Final Report of Sub Project II International Tropical Timber Organization- Japan Oversea Forestry Consultants Association, pp.1-78.
- Champion H.G. and Seth S.K.1968. A Revised Survey of Forest Types of India (New Delhi: Government of India Publication)
- Mc Cloy, K.R. and Hall K.A, 1991. Mapping the density of woody vegetative cover using Landsat MSS digital data; Int Remote Sensing 12 1877-1885.
- Rikimaru A1996. Lnadsat TM Data Processing Guide for Forest Canopy Density Mapping and Monitioring Model; Project of PD32/93 Rev. 2(F) ITTO -Japan Overseas Forestry Consultants Association, Pp.1,1-1, 8.
- Roy p.s., Diwakar P.G., Vohra T.P.S. and bahn s.k.1990. Forest Resource management Using Indian Remote Sensing Satellite data; Asian -Pacific Remote Sensing J. 3 11- 22.
- Wu J.K., Zheng Q.F.W.T. 1985,A forest inventory using Landsat imagery in the Mao-shan area of China;Int.J. Remote Sensing 61783-1795.