| GISdevelopment.net ---> AARS ---> ACRS 1997 ---> Forestry |
Forest Monitoring Framework
At Regional Level Using Multi-Resolution Satellite Data With Comdination
Of Optical And Thermal Bands
Dr. Surat Tertlum* Chair
Prof. Shunji Murai** Dr. Kiyoshi Hinda**
*Computer Science Department
Chulachomklao Military Academy, Thailand
E-mail: surat@cs.ait.ac.th, surat@crma.ac.th
** Space Technology Application and Reserch (STAR) Program
Asian Institute of Technology, Thailand
Abstract *Computer Science Department
Chulachomklao Military Academy, Thailand
E-mail: surat@cs.ait.ac.th, surat@crma.ac.th
** Space Technology Application and Reserch (STAR) Program
Asian Institute of Technology, Thailand
In order to study the regional scale reforestation process in Indo-China Peninsula. Suitable forest classification system is a main requirement for such the study. Since high resolution data set is not suitable of the data volume. A solution is by using low-resolution remotely sensed data (NOAA AVHRR LAC 1.1km) as the main data source, and resolution-remotely data (Landsat TM30m) as the ground truth data for monitoring and analysis of primary forest, secondary forest, and other vegetation resources. A vegetation classification methodology from the integration of low and high resolution remotely-sensed data with the combination of optical and thermal bands has been developed and proposed for this forest classification system.
This paper describes the vegetation classification methodology developed from the integration of low and high-resolution remotely sensed data with the combination of optical and thermal bands using multi-resolution satellite data, and the reforest monitoring framework at regional level is proposed for further implementation.
Introduction
Forest play a key role in global ecological balance. The world's deforested land increases fastest in Asia at 1.4 percent a year. In 1980, only 0.6 percent of the tropical forests were assumed to have disappeared. Today, the decreasing rate has doubled to 1.2 percent, or almost 17 million ha a year, mainly because of population growth and poverty. In developing countries, like Thailand, forest area was reduced from 53.33% in 1961 to 27.95% in 1989 and 26.64% in 1991 (RFD,1992)
Definition Of Land Types
For the purpose of this study, land types are defined into 5 classes according to their vegetation activities, without the separation of natural or planted vegetation, as follow:
- primary Forest is the forest area that is still very dense and undisturbed. This type of forest includes tropical evergreen forest, tropical rain forest, and some dense mixed deciduous forest.
- Secondary forest is the forest area that is rather cleared, includes some type of mixed deciduous forest, dry dipterocarp forest, and forest area that is abandoned due to deforestation. Normally, it has lower density of tree and also the size of the trees is considerable smaller.
- Active agriculture is the agriculture land that is in the full grown condition such as rice field, or corn field, etc.
- Harvested Land is the agriculture land that is already harvested. This type of land is still have some small vegetation cover.
- Bare Soil is the land type that is covered by no vegetation.
Both low resolution are proposed to be used in this study.
- Low Resolution Satellite Data (NOAA AVHRR LAC 11 km)
The Cloud-free NOAA AVHRR mosaic National Institute of Environmental Studies (NIES) of Japan is used as the tested data. The mosaic covers an area extending from East 66 degree to East 110 degree, and from North 0 degree to north 35 degree. The mosaic is composed from AVHRR images recorded by NOAA-11 during the year1990. - High resolution Satellite Data (LANDSAT TM 30 m.)
Because of the proposed multi-resolution classification scheme, high-resolution data have to correspond to the data resolution data. Landsat TM data set according to the NIES's 1990 data is selected.
A solution that is proposed for forest classification system of Indo-China Peninsula is to use low resolution data as the main source for monitoring vegetation activity. In order to improve the classification method to achieve better accurate, a new vegetation index, which is the combination of optical and thermal bands, has been developed in this study. To minimize the disadvantage of low accuracy from using low-resolution data, high resolution data is also utilized to calibrate the classified result obtained from low resolution data, (LERTLUM, 1997)
New Vegetation Index
In this study, the difference of characteristic of visible (bands 1) and near-infrared (band 2) in the from of NDVI, and thermal data (band 4) from NOAA AVHRR (LAC 1. Km.) of each land type in the test area are examined and compared. It is found that the combination of information from NDVI and thermal band is more useful to classify the land types than NDVI along as shown in Figure 1.
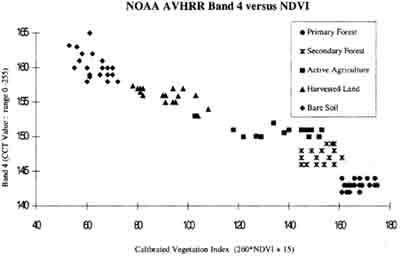
Figure 1 Scatter diagram of CCT Value of Band 4 versus NDVI from NOAA AVHRR
From the analysis, it is found that in order to effectively utilize thermal band, the product of the NDVI and Thermal ratio should formulate the new vegetation index from the combination of thermal ratio with NDVI, which is related to vegetation activity. The new vegetation index is named Normalized Thermal- NDVI (NT-NDVI). The thermal ratio should be able to reflect the difference of land types according to the characteristic of vegetation cover to brightness temperature. It should also represent the normalized brightness temperature factor of NT-NDVI that can be used for the whole region. From the experiment and analysis, the proposed thermal ratio in normalized according to the following formula:
| Normalized Thermal Ratio= | 1.0+ | (Local Max Brightness Temp-
Actual Brightness Temp)
--------------------------------------------- Local Max Brightness Temp |
Where
Local Max Brightness Temp : is the local maximum brightness temperature of the selected pixel
Actual Brightness Temp : is the brightness temperature of the selected pixel
then
The ratio od relative difference of local brightness temperature to the local maximum brightness temperature divided by the maximum brightness temperature of the area is used. The local maximum brightness temperature is selected from the highest brightness temperature value in the square area surrounding selected pixel. This thermal ratio will reduce the effect of the temperature difference according to the latitude of the location or order factors such as recording data and time, or the altitude of the location, and will lead to the stability of the thermal ratio. From the analysis of characteristic of the local maximum brightness temperature versus the size of the area used for the calculation of the local maximum brightness temperature, the most appropriate area size for the clculation of local maximum brightness temperature is 60 x 60 km2.
The analysis for new vegetation index is also applied to high resolution data (Landsat TM), which responds with similar characteristic as low resolution data.
This new vegetation index makes it possible to achieve better accuracy of the classification of primary forest, secondary forest, active agriculture land, harvested land, and bare soil, which could not be clearly classified by existing NDVI. In addition, this new vegetation index is stable over are, so it is possible to apply same thresholds out the study area.
Multi-Resolution Integration Technique
This process is accomplished by defining a regression model between the same parameters of low and high resolution satellite data. This process had been demonstrated before by Yasuoka et al. (1995) on NDVI from NOAA AVHRR and Landsat TM.
In this study, the average of band 3, band 4, and band 6 from Landsat TM are calculated to produce the datasets that has the same resolution as 1.1 km of NOAA AVHRR LAC 1.1 km. To use for the calculation of NT-NDVI. Next, the georeference between low resolution and the average high resolution datasets is performed. Finally, the regression model is calculated between NT-NDVI from low resolution and the averaged high resolution (LERTLUM, 1997)
The analysis between the NT-NDVI from averaged TM and NOAA AVHRR is performed as shown in Figure 2. From the study on NT-NDVI from averaged Landsat TM and from NOAA AVHRR, the relationship can be described by the following equation:
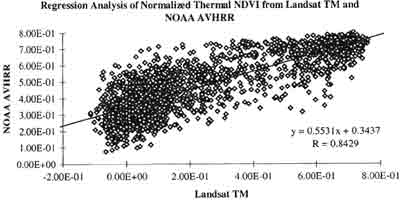
Figure 2 Scatter diagram of NT-NDVIavhrr versus NT-NDVItm
Where
NT-NDVIavhrr is Normalized Thermal -NDVI from NOAA AVHRR
NT-NDVItm is Normalized Thermal from Landsat TM
Vegetation Classification Methodology Using Multi-Resolution Data with Combination of Optical and Thermal Bands
The main theme of the integrated classification is to use NT-NDVI with the threshold for each land class from high resolution data to improve the thresholds used low resolution model to yield the thresholds used for low resolution data.
The most important issue that is the main advantage of multi-resolution classification is the primary forest, secondary forest, and active agriculture can be separated with ease by using the calibration of NT-NDVI thresholds from Landsat TM NT-NDVI. This comes from the fact that is very difficult the thresholds from low resolution data alone to differentiate primary forest, secondary forest, and active agriculture.
Low resolution data (NOAA AVHRR) with support of calibrated high resolution data (Landsat TM) were used to produce forest map in Indo-China Peninsula on the assumption that similar characteristics of the ground truth area can be extended to other area. Even though the verification was difficult to undertake due to lack of reference data, this methodology could be an estimate for forest monitoring in Indo-China peninsula.
The classified result from developed methodogy from NOAA Mosaic of southeast Asia (1990) from NIES is illustrated in Figure 3. The thresholds used for the classification are in Table 1. The result from error analysis from thailand' Forest map is illustrated in Table 2. The statistic of the classified result for each country in Indo-China Peninsula using calibrated NT-NDVI is illustrated in Table 3.
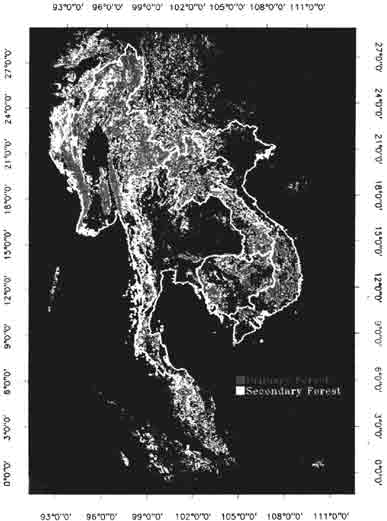
Figure 3 Classified result from Calibrated NT-NDVI (Indo-China Penensula, 1990)
| Land Class | NT-NDVI | Calibrated NT-NDVI | |
| 1 | Primary Forest | 0.70 | 0.6821 |
| 2 | Secondary Forest | 0.59 | 0.5913 |
| 3 | Active Agriculture | 0.41 | 0.41 |
| 4 | Harvested Land | 0.29 | 0.29 |
| 5 | Bare Soil | -0.05 | -0.05 |
| NT-NDVI | Accuracy |
| Central Plain | 92.55% |
| Northern Part | 78.58% |
| Southern part | 85.88% |
| Averaged | 85.67% |
Form the calculated statistic of forest area classified from NIES (1990) data in Table 3, Thailand's forest area is 2.03%. From the statistic of Thai's Royal Forest Department, Thailand's forest area is 26.64% (RED, 1992). The different is 1.61 %. Also, the statistical result for only primary forest class is 10.32 %. This statistical result is close to the statistic from RED that stated 12.2 % is Tropical Evergreen Forest (RED, 1992), which by the definition of this study categorizes this type of forest to be primary forest. This result shows that this new classification methodology can achieve the proposed objective.
| Land Type | Thailand | Mayanmar | Laos | Cambodia | Vietnam |
| Water Area | 0.26% | 0.19% | 0.08% | 0.94% | 1.49% |
| Bare Soil | 16.69% | 3.26% | 2.74% | 12.24% | 24.18% |
| Harvested Land | 26.97% | 9.40% | 5.90% | 12.65% | 14.77% |
| Active Agriculture | 31.05% | 17.69% | 23.63% | 29.63% | 27.79% |
| Secondary Forest Area | 14.71% | 19.72% | 23.02% | 19.04% | 13.15% |
| Primary Forest Area | 10.32% | 49.74% | 44.43% | 25.50% | 18.63% |
Forest Monitoring Framework for Indo-China peninsula
By using the proposed vegetation classification methodology from multi-resolution satellite data with combination of optical and thermal bands, it is possible to monitor the primary and secondary forest area in Indo-China Peninsula regularly because the acquiring rate from low resolution satellite is rather high. And the proposed methodology can be applied to build an automated monitoring system.
The proposed forest monitoring framework is illustrated in Figure 4.
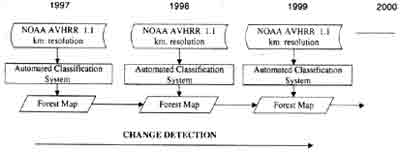
Figure 4 The Proposed Forest Monitoring Framework
Reference
- LERTLUM, SURAT, Vegetation Classification Methodology From Multi-Resolution Data By The Combination of Optical And Thermal Bands, Doctor of Technical Science Dissertation, Asian Institute of Technology, Bangkok, Thailand, 1997.
- RED, 1992, Forestry Statistics of Thailand.
- YASUOKA, Y., SUGITA, M., YAMAGATA, Y., TAMURA, M., SUHAMA, T., 1995 Scaling Between NOAA AVHRR Data and Landsat TM Data for Monitoring Wetland, processing of the International symposium on Vegetation Monitoring, Chiba, Japan.