| GISdevelopment.net ---> AARS ---> ACRS 1997 ---> Forestry |
Development of Forest Canopy
Density Mapping and Monitoring Model using Indices of Vegetation, Bare
soil and Shadow
A. Rikimaru, s. Miyatake*
College of Engineering, Hosei University
3-7-2, Kajino- Cho Koganei-shi, Tokyo 184, Japan
Tel: (81)-423-87-6115 Fax (81) -492-92-7414
E-mail: rikimaru@a1.mbn.or.jp
*Japan Overseas Forestry consulatants Association
rinyuu-Blgd:1-7-12 Koraku, Bunkyo-Ku, Tokyo 112, Japna
Tel: (81)-3-5689-3435 Fax (81)-3-5689-3439
E-mail: Jofca@alpha-web.or.jp
Abstract College of Engineering, Hosei University
3-7-2, Kajino- Cho Koganei-shi, Tokyo 184, Japan
Tel: (81)-423-87-6115 Fax (81) -492-92-7414
E-mail: rikimaru@a1.mbn.or.jp
*Japan Overseas Forestry consulatants Association
rinyuu-Blgd:1-7-12 Koraku, Bunkyo-Ku, Tokyo 112, Japna
Tel: (81)-3-5689-3435 Fax (81)-3-5689-3439
E-mail: Jofca@alpha-web.or.jp
Forest canopy density is one of the most useful parameters to consider in the planning and inplementation of rehabilitation program. This study is development of bio-phsycal analysis model for obtaining of forest Canopy Density (FCD) using LANDSAT TM data image analysis. The components FCD model are four factors; vegetation, bare soil, thermal and shadow. This work is implemented under the research project; PD32/93 Rev2(F) of International Tropical Timber Organization (ITTO).
1.Introduction
The Forest Canopy Density (FCD) Mapping and monitoring Model utilized forest canopy density as an essential parameter for characterization of forest conditions. FCD data indicates the degree of degradation, thereby also indication the intensity of rehabilitation treatment that may be required.
The source remote sensing data for FCD model is LANDSAT TM data. The FCD model comprises bio-physical phenomenon modeling and analyis utilizing data derived from four(4) indices: Advanced Vegetation Index (AVI), Bare Soil Index (BI), shadow Index or scaled Shadow Index (SI, SSI) and Thermal Index (TI). It determines FCD by modeling operation and obtaining from these indices.
The canopy density is calculated in parentage for each pixel. The FCD model requires less information of ground truth. Just for accuracy check and so on.
FCD model is based on the growth phenomenon of forests. Consequently, it also becomes possible to monitor transformation of forest conditions over time such as the progress of forestry activities.
The application test were implemented in these area. The evergreen forests are in the islands of Luzon (Philippines) and Sumatra (Indonesia); and for monsoon (subtropical deciduous) forest in Ching -Mai (Thailand) and Terai (Nepal).
2.Characteristics of Forest (4) Indices
The indices have some characteristics as below. The Forest Canopy Density Model combines data from the four (4) indices. Fig. 1 illustrates the relationship between forest conditions and the four indices (VI, BI, SI and TI). Vegetation index response to all of vegetation items such as the forest and the grass land. Advanced vegetation index AVI reacts sensitively for the vegetation quantity compared with NDVI. Shadow index increases as the forest density increases. Thermal index increase as the vegetation quantity increases. Black colored soil area shows a high temperature. Bare soil index increases as the bare soil exposure degrees of ground increase. These index values are calculated for every pixel. Fig. 1 shows the characteristics of four indices compared with forest condition.
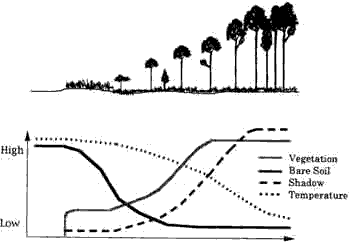
Fig. 1 The Characteristics of four indeces for forest condition
Note that as the FCD value increase there is a corresponding increase in the SI value. In other words where there is more tree vegetation there is more shadow. Concurrently, if there is less bare soil (i.e. a lower BI value) there will be a corresponding decrease in the TI value. It should be noted that VI is "saturated" earlier than SI. This simply means that the maximum VI values that can be regardless of the density of the trees or forest. On the other hand, the SI values are primarily dependent on the amount of tall vegtation such as tree which cast a significant shadow.
Table.1 shows combination characteristics between four indices.
| Hi-FCD | Low-FCD | Grass-Land | Bare Land | |
| AVI | Hi | Mid | Hi | Low |
| BI | Low | Low | Low | Hi |
| SI | Hi | Mid | Low | Low |
| TI | Low | Mid | Mid | Hi |
3.Obtaining of Four(4) Indices
a. Advanced Vegetation Index (AVI)
When assessing the vegetation status of forests, the new methods first examine the characteristics of chlorophyll-a using a new Advanced Vegetation Index (AVI) that is calculated with the following formulae.
B1~B7: TM Band 1~7 data
B43=B4-B3 after normalization of the data range.
CASE-a B43<0 AVI= 0
CASE-b B43>0 AVI=((B4+1)x (256-B3) x B43)1/3
b. Bare Soil Index (BI)
The value of the vegetation index is not so reliable in situations where the vegetation covers less than half of the area. Fore more reliable estimation of the vegetation status, the new methods include a bare soil index (BI) which is formulated with medium infrared information. The underlying logic of this approach is based on the high reciprocity between bare soil status and vegetation status. By combining both vegetation and bare soil indices in the analysis, one may assess the status of forest lands on a continuum ranging from hi vegetation conditions to exposed soil conditions.
B1=((B5+B3)-(B4+B1)) / ((B5+B3) + (B4+B1)) x 100 +100
; 0<BI <200
The range of BI is covered within 8 bits range]
c. Shadow index (SI)
One unique characteristic of a forest is its three dimensional structure To extract information on the forest structure from RS data, the new methods examine the characteristics of shadow by utilizing (a) spectral information on the forest shadow itself and (b ) thermal information on the forest influenced by shadow.
The shadow index is formulated through extraction of the low radiance of visible bands.
SI=((256-B 1)x (256-B2) x (256-b3))1/3
d. Thermal Index (TI)
Two (s) factors account for the relatively cool temperature inside a forest. One is the shielding effect of the forest canopy which blocks and absorbs energy from the sun. The other is evaporation from the leaf surface which mitigates warming. Formulationof the thermal index is based on these phenomenon. The source of thermal information is the infrared band of TM data.
4. The Procedure of FCD Model
The flowchart of the procedure for FCD mapping model are illustrated in Fig.2. Image processed result corresponding to the flowchart shows in fig.3.
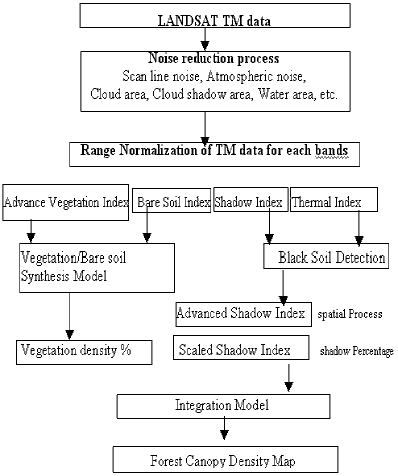
Fig. 2 Flow chart of FCD Mapping Model
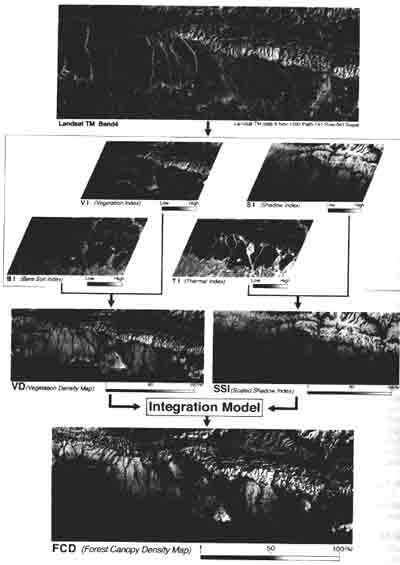
Fig. 3 Procedure of FCD (Forest Canopy Density) Mapping Model
a. Noise Reduction; Clouds, cloud shadow and water area
Clouds have a higher irradiance value than ground data. Moreover, the amount of irradiance varies depending on whether the clouds are white, gray, black or combinations of different shades. These factors adversely influence statistical treatment and analysis of imagery data. Furthermore, cloud shadow can be confused with shadow cast by adjacent mountains, These problems can be minimized by creating a cloud shadow mask, using a histogram based on data derived from TM band 1,2 and 3. Thereafter, a shadow mask of the mountain shadow area s formed at the ground level. This is done through parallel transformation of the mask of the cloud area. Water bodies create similar problems. Since water absorbs near infrared, water bodies should (and can) also be masked using a histogram of TM Band4.
b. Vegetation Density; VD
It is the procedure to synthesize VI and BI.. Processing method is using principal component analysis. Because essentially, VI and BI have hight correlation of negative. After that, set the scaling of zero percent point and a hundred percent point. Details in (A. Rikimaru, 1996)
c. Black Soil Detection
SI data is extracted from the low irradiance area of each visible band. Where the soil black or appear to be black due to recent slash-and-burn, low irradiance data may confuse shadow phenomenon with black soil conditions. This is because black soil usually has high temperature due to its high absorption rate of sun energy. But shadow lead to a decrease in soil temperature. By overlying TI data this confusion can be avoided. Overlays are also useful when evaluating the relative irradiance of different parcels of land characterized by various shades of black soil.
d. Advance Shadow Index; ASI
When the forest canopy is very dense, satellite data is not always be able to indicate the relative intensity of the shadow. Consequently, crown density might be underestimated. To deal with this problem, the new methods include those described below for determining the spatial distribution of shadow information. Details in (A.Rikimaru.1996).
e. Scaled Shadow Index; SSSI
The shadow index (SI) is a relative value. Its normalized value can be utilized for calculation with other parameters; The SSI was developed in order to integrate VI values and SI values. In areas where the SSI value is zero, this corresponds with forests that have the lowest shadow value (i.e.0%). In areas were the SSI value is 100, this corresponds with forests that have the highest possible shadow value (i.e.100%).SSI is obtained by linear transformation of SI. With development of the SSI one can now clearly differentiate between vegetation in the canopy and vegetation on the ground. This constitutes one of the major advantage of the new methods. It significantly improves the capability to provided more accurate result from data analysis than was possible in the past.
f. Integration process to achieve FCD model
Integration of VD and SSI means transformation for forest canopy density value. Both parameter has dimension and has percentage scale unit of density. It is possible to synthesize both indices safely by means of corresponding scale and unit of each
5.Result and Comments
The accuracy of methodology is checked in field test. The case of Sumatra Indonesia, The correlation coefficient value between FCD model and field check shows 0.922. It indicates very high correlation and results means high accuracy.
FCD model is very useful for monitoring and management for the future with less ground truth survey.
Acknowledgment
This work was carried out with the project of International Tropical Timber Organization (ITTO). The authors would like to express gratitude to Dr. Surachai NRCT Thailand Agung Ministry of Foresty Indonesia, Dr. P.S.Roy IIRS India, Dr.Virgilio F.Basa Philippines, Mr. K.B. Chitrakar Institute of Foresty Nepal, Mr. Patric C.Dugan and all of counterpart persons for their ITTO project support.
Reference
- JOFCA.1991. Classification system on logged-over forest. A workshop for the ITTO projects PD2/87(F) Subproject II. Rehabilitation of logged-over forest in Asia/Pacific. Manila, Philippines, December 1991.
- JOFCA.1993.rehabilitation of logged-over forest in Asia/Pacific region, final report of sub-projects II. Prepared for ITTO. March 1993. Part II pp.1-41
- JOFCA.1995. Proceedings of the workshop on utilization of remote sensing in site assessment and planning for rehabilitation of logged-over forest. Cisarua, Bogor. Indonesia, September 25-28,1995.
- JOFCA.1996. Proceedings of the workshop on utilization remote sensing in site assessment and planning for rehabilitation of logged-over forest. Bangkok, Thailand , July30- August 1,1996.
- A.Rikimaru. 1996. LAMDSAT TM Data Processing Guide for forest Canopy Density Mapping and Monitoring Model. ITTO workshop on utilization of remote sensing in site assessment and planning for rehabilitation of logged-over forest. Bangkok, Thailand, July 30- August 1,1996.pp.1-8
- JOFCA. 1997. Utilization of remote sensing in site assessment and planning for rehabilitation of logged-over forests. Project report on PD32/93 Rev.2(F) Rehabilitation of logged-over forest in Asia/ Pacific region, Sub-project III Prepared for ITTO. January 1997.