| GISdevelopment.net ---> AARS ---> ACRS 1997 ---> Forestry |
Separation (Recognition) of
tree species or species composition in an old growth forest Plantation in
Peninsular Malaysis using the Vegetation Index approach
Nor Azman
Hussein1 and Mazlan Hashim2
1Forest Research Institute Malaysia (FRIM)
Tel: 03-6302117, Fax: 03-6367753,
E-mail: norazman@frim.gov.my
2Faculty of Engineering and Geoinformation Science
University Teknoligi Malaysia (UTM)
Locked Bag 791, 80990 Johor Bahru
Tel: 07-5502940, Fax: 07-5566163,
E-mail: mazlan@fksg.utm.my
Abstract 1Forest Research Institute Malaysia (FRIM)
Tel: 03-6302117, Fax: 03-6367753,
E-mail: norazman@frim.gov.my
2Faculty of Engineering and Geoinformation Science
University Teknoligi Malaysia (UTM)
Locked Bag 791, 80990 Johor Bahru
Tel: 07-5502940, Fax: 07-5566163,
E-mail: mazlan@fksg.utm.my
Most of the standard image classification procedures extract information form remotely sensed data using spectral characteristics alone. Although these procedures are quite effective for general mapping purposes, purely spectral classifiers have limitation when used to map detailed information such as tree species or composition, especially when there is an abundance of mixed pixels (mixels) or if there is substantial overlap in the spectral definition of the classes. These factors have significantly contributed to the failure to apply remote sensing technology to forest management, especially at operational level. This limitation is especially felt in the tropical forest environment when classification by tree species or species composition is required. Quantitative analysis using Vegetation Index (VI), simple regression, and a modeling approach have been proven effective to estimate vegetation properties independent of vegetation types. Of the three, VI is the most commonly used; that is by linearly combining or rationing reflectance in the red and in the near infrared (NIR) spectral region. The use of these spectral regions is due to their "characteristic" responses to vegetation properties and as such, VI is highly correlated to biophysical factors such as biomass density, leaf index (LAI), vigorousness, canopy and leaf structure, etc. In this paper we examine the capability of 6 different types of VI derived from Landsat TM data to differentiate or recognize tree species or species composition of a well-documented old growth forest plantation test site at Bukit Lagong in Peninsular Malaysia. Result of the study show that there was a positive correlation of VI to tree species or species composition with an overall accuracy of 60%, an encouraging factor for pursuing the study
Introduction
There has been rapid development in multispectral remote sensing since its introduction in the 70's. However, the development of remote sensing technology for application in tropical forestry has been rather slow. This is mainly due to the complex characteristics of the tropical forest and the lack of quantitative analysis of multispectral remote sensing data to actual ground information. With better understanding of the remote determined and their full potential can be realized.
The typical spectral reflectance curve for vegetation is primarily caused by variations in biophysical aspects of the plant and its stand structure. This is because these factors absorb, reflect and emit EMR different part of the spectrum. These differences are attributed to the intensity of the pigments (maily chlorophyll), internal cellular structure of plant leaves, moisture content and leaf thickness. Chlorophyll, the green pigment in plant leaves, strongly absorbs EMR at about 0.45mm (blue band) and 0.67 mm (blue band), and
Reflects green energy (0.52-0.6 mm) which causes healthy vegetation to appear green. Variation in intensity of chlorophyll in the plant, either naturally or caused by stress, abnormal growth and productivity, result in reduction of absorption of the blue and red bands. Theoretically, characteristics of reflectance in the chlorophyll-absorptance region can be used to separate different vegetation and/or vegetation classes in remote sensing data.
Plant internal structure also varies considerably either under natural conditions or abnormal growth and stress. Inherent characteristics of the internal structure of healthy plant leaves cause 40 to 50 percent of the NIR portion of the EMR spectrum (0.7-1.3 mm) incident upon it to be reflected. Distinct characteristics of spectral reflectance in the NIR region is another aspect that would enable separation of vegetation that otherwise looks the same in visible wavelengths. The use of spectral reflectance in the NIR in combination with other optical bands, particularly red, could further enhance the recognition of vegetative types.
The method of using 'infra-red' bands in combination with optical bands to study vegetation is termed Vegetation Indices (VI). It is defined as "mathematical transformations designed to assess the spectral contribution of vegetation to multispectral observation" (Elvidge and Chen, 1995). The most basic assumption in VI is that algebraic combination of remotely sensed spectral bands correlate to the presence of green vegetation in the pixels scene. This is based on the characteristic of the green vegetation spectru; there is intense chlorophyll pigment absorption in the red (R) against the high reflectivity of plant materials in spectrum are widely used. There is a vast number of publications that discuss R and NIR use of VI to estimate vegetation variables such as percent green cover, leaf area index (LAI), absorbed photosynthetically active radiation (APAR) and others either for general vegetation studies or related to forestry (Fisher, 1994; Huete et al., 1994; Myneni & Williams, 1994; Spanner et al., 1994) The R and NIR combination is normally in the form of a ratio, a slope, or other formulation that can generally be separated into three categories, namely intrinsic indices, soil-line related indices, and atmospheric-corrected indices (Rondeaux, Steven and Baret; 1996). Nonetheless, there are other less commonly used algebraic combinations which utilize multiple spectral bands.
Method
- Study Site
The study site covers the are of old growth forest plantation of the Forest Research Institute Malaysia (FRIM) situated within the Bukit Lagong Forest Reserve. The forest reserve is situated 11 km north-west of Kuala Lumpur within the latitude of 3013' to 3015'N and longitude of 101036' and 101039' E (Figure 1). The plantation area was established as early as 1927. The plantation area was divided into compartments in which various species wee planted; some compartments with mono-species while others were mixed. Thus, throughout the study site species composition is varied. However, the species are not widely and randomly distributed. They form rather clumpy patches, some with a very distinct boundary. In terms of vertical structure of the forest, vegetation in this plot has reach the 'near climax' situation n which it has a physical appearance of a primary forest with some of the older trees having reached a height of more than 30 m.
Historical planting records were available for the whole plantation area. Using these records and the geocoded vector map of the area, a thematic map of species distribution with the result of VI.
- TM data and preprocessing
Two sets of TM data of 1988 and 1993 wee used in this study. There was no technical reason why the 2 images were chosen. These wee the only available daa which were free of cloud cover and had no apparent haze effect. Prior to analysis, the image were geometrically corrected. The control points were selected from common points recognizable on the images and topographic map. Seven points wee used for the 1988 image and 13 points for the 1993 image. The image were corrected using 2nd and 3rd degree polynomials for the 1988 (RMS error = 0.37 pixels) and 1993 (RMS error = 1.03 pixels) images respectively. The pixels were resampled by the nearest neighbour method to maintain their original data. The vector map was then reistered to the images. Masking was done so as to include only the forested areas. Neither radiometric correction nor correction for terrain effects was carried out for both images. Theoretically, VI will normalize radiometric and terrain effects.
- Vegetation Indices
For this preliminary study, 6 VIs were used for each image following Malingreau (1989). A detailed discussion on all the 6 indices are presented in the said paper. The 6 are:- Normalised Different Vegetation Index (NDVI)
NDVI = TM4-TM3
--------------
TM4-TM3
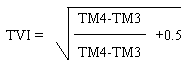
- Transform Vegetation Index (TVI)
- Ratio Vegetation Index (RVI)
RVI = TM4
---------
TM3
- Simple subtraction Vegetation Index (SVI)
SVI = TM4-TM3
- F1 nad f2 (Malingreau) Indices
F1 = TM2
--------------
TM4 x TM3
F2 = TM4xTM3
--------------
TM2
- Normalised Different Vegetation Index (NDVI)
The VI values were found to correlate with 6 species, namely Pinus insulariis, Pinus caribeae, Pterocarpus sp., Dryobalanops sp., Dipterocarpus sp. And Shorea sp. It was also possible to determine the range of values for each of these species. However, their values varied tremendouslyfor different VIs and the two images. Nonetheless, the values do not overlap. Between the 6 species only P. insularies and Pterocarpus sp. Show some overlap when NDVI and F2 methods were used. It is also interesting to note that there are several instances where VIs produced a singly value. A comparison of these VI values is presented in Table 1.
| 1988 | 1993 | |||||||||||
| RVI | TVI | NDVI | SVI | F1 | F2 | RVI | TVI | NDVI | SVI | F1 | F2 | |
| Pinus Insularis | 1.955- 2.535 |
0.907- 0.947 |
0.322- 0.402 |
26-34 | 0.019- 0.023 |
48-58 | 1.599- 1.959 |
0.849- 0.902 |
0.229- 0.309 |
16-24 | 0.017- 0.021 |
44-52 |
| Pinus caribeae | 2.855- 3.195 |
0.967- 0.987 |
0.462- 0.502 |
50-61 | 0.011- 0.013 |
70-80 | 2.259- 2.739 |
0.942- 0.982 |
0.389- 0.449 |
36-50 | 0.011- 0.012 |
77-96 |
| Angsana | 3.315- 3.435 |
0.787- 0.887 |
0.622 | 45-49 | 0.025- 0.335 |
40-47 | 3.059- 3.099 |
0.822 | 0.169- 0.229 |
11-14 | 0.009- 0.010 |
45-49 |
| Dryobalanops Aromatica | 3.455- 3.795 |
1.027 | 0.562- 0.582 |
62-69 | 0.009 | 81-88 | 2.959- 3.019 |
0.996 | 0.549- 0.569 |
30-35 | 0.023- 0.028 |
66-73 |
| Keruing | 3.8353- 3995 |
1.007 | 0.522- 0.542 |
35-44 | 0.015- 0.017 |
60-70 | 3.539- 3.699 |
0.916- 0.929 |
0.329- 0.369 |
25-29 | 0.013 | 99-108 |
| Meranit | 4.075- 4.355 |
1.047 | 0.602 | 79-85 | 0.007 | 89-95 | 3.319- 1.036 |
1.009- 1.036 |
0.489- 0.529 |
53-60 | 0.015- 0.016 |
54-65 |
The confusion matrix shows that accuracy varies for the different VIs and the two different years. Accuracy ranged from slightly above 40% to almost 80 percent. The 1988 data resulted in higher accuracy as compared to the 1993 data. The comparison of the different VIs shows that for eh 1988 image SVI and F1 produced the highest accuracy of different VIs in classifying the 6 species from the 2 images is presented in Table 2.
| 1988 | 1993 | |
| Average | Average | |
| SVI | 74.54 | 60.92 |
| RVI | 55.87 | 64.35 |
| NDVI | 56.21 | 62.40 |
| TVI | 61.33 | 65.01 |
| F1 | 77.53 | 53.12 |
| F2 | 60.32 | 41.31 |
Summary
The VIs were found to be significant in helping to recognize and map forest species where the mixture of species are not as complex as in a natural forest. With the increase in the scale of reforestation and esablishment of forest plantations carried out in Malaysia and throughout the region, remote sensing can become a very useful survey and mapping approach for the management of future forest or natural resources. Even though under this study the classification was generalized and limited to only 6 species, it could, nevertheless, indicate that a more detailed analysis may uncover new potentials for using remote sensing data to map forest resources at a much refined scale suitable for various practical management uses. One of the disadvantages of TM data is in its spatial resolution at a much refined scale suitable for various practical management uses. One of the disadvantages of TM data is in its spatial resolution which results in mixed pixels. It is impossible to classify these mixed pixels down to species level. With the availability of a new higher resolution sensor, the problem of mixed pixels may be resolved. The authors feel very strongly that with higher spatial resolution data, the success rate in mapping forest resources, especially forest plantation areas, at species level will be much higher.
Acknowledgement
The authors wish to record our appreciation to En Anan Ahmad for carrying out the mapping and digital processing work.
Reference
- Elvidge, C.D. and Chen, Z. (1995). Comparison of broad-band and narrow-band Red and Near-Infrared Vegetation Indices. Remote Sens. Environ. 54,38-48.
- Fisher, A. 1994. A model for the seasonal variation of vegetation indices in coarse resolution data and its inversion to extract crop parameters. Remote Sens. Environ., 48:220 -230.
- Huete, A., Justice, C. and Liu, H. 1994. development of vegetation and soil indices for MODIS EOS. Remote Sens. Environ., 49:224-234.
- Malingreau, J.P> 1989. The vegetation index and the study of vegetation dynamics. In Toselli F. (ed.)/ Application of Remote Sensing to Agrometeorology. Kluwer Academic Publisher, Brussels. Pp 285-303.
- Myneni, R.B. and Williams, D.L. 1994. On the relationship between FAPAR and NDVI Remote Sens. Environ., 49:200-211.
- Rondeaux, G., Steven, M., and Baret, F. 1996. Optimization of soil-adjusted vegetation indices. Remote Sens. Environ. 55:95-1907.
- Spanner, M., Johnson, L., Miller, J., McCreight, R., Freemantle, J., Runyon, J. and Gong, P. 1994. Remote sensing of seasonal leaf area index across the Oregon transect. Ecological Application, 4(2): 258-271.