| GISdevelopment.net ---> AARS ---> ACRS 1997 ---> Disasters |
Slope Instability and Hazard
Zonation Mapping Using Remote Sensing and GIS Techniques in the Area of
Cameron Highlands, Malaysia
Andy Yaw Kwarteng and Dhari
Al-Ajmi
Remote Sensing Group, Environmental and Earth Sciences Division
P.O. Box 24885, 13109 Safat, Kuwit
E-mail: andyk@sunpci,kisr.edu.kw
Remote Sensing Group, Environmental and Earth Sciences Division
P.O. Box 24885, 13109 Safat, Kuwit
E-mail: andyk@sunpci,kisr.edu.kw
Abstract
Kuwait's oil lakes which were created during the 1991 Arabian Guld War have become an unwanted part of Kuwait's desert, and require continuous monitoring to determine the nature and extent of risks to the environment. Analysis of Landsat Thematic Mapper ™ and Satellite Pour d'Observation de la Terre (SPOT) images showed that the total area covered by oil lakes, tarmats and soot in 1992 was 1772 km2; however, the area in the satellite images, they remained in the soil covered by a veneer of sand. The total oil lakes area calculated from March 1995 TM image was 38.93 km2. Of that, 35.45 km2, or 90% was observed in the Greater Burgan oil field, Kuwait's largest oil producer. Most of the contaminated areas showed resilience and remarkable ability to support vegetation in the presence of adequate water, four years after the oil takes' event.
Introduction
One of the disastrous consequences of the 1991 Arabian Gulf War was the burning of oil wells and the subsequent creation of oil likes. During the War, Iraqi forces set ablaze 656 active oil producing wells and damaged 74 other for the crude oil to gush freely. The free-flowing crude oil accumulated and formed a network of oil rever and oil lakes. Approximately 300 oil lakes of various size covering an area of 49 km2 were bequeathed to kumait's desert environment. Some of the oil rivers and showed lakes dried up with time to from tarmats, but the rest had become an unwanted addition to kumait's environment. Twenty-one million barrels of oil representing 96% of the oil were recovered and exported by Kuwait oil cooperation (KOC) and Kuwait Petroleum Cooperation (KPC). The remaining one million barrels are left at the mercy of Kuwait's harsh weather, and are sources of environmental hazards to plants and animals. Serversl rehabilition methods, inciding bioremedition, are under consideration (Balba et al, 199), but no large- scale techniques for the remedition of the affected area have been implemented.
The interation of the lakes and other contaminated areas with the environment needs constant monitoring to document th erecovery of the affected land. Kuwait's oil lakes more or less the first of its kind in the world and therefore, any lessons learnt will be administrators. Due to the digital format, availability and cost-effectiveness, analysis of satellite remotely
Sensed data provides an invaluable techniques to monitor the oil lakes on a continuous basis. In this study satellite image consisting of Landsat Thermatic Mapper (TM), and Satellite pour d,Observation de la There (SPOT) acquired between 1987 were used to map spatial and temporal changes of the oil lakes and environs and also to monitor the resilience of the affected areas.
Study Area and Datasets
like more parts of the Arabian Shield, Kuwait is characterized by a desert type environment (i.e.,little rainfall and dry hot climate). Summers are hot, especially July and August, with maen temperatures of 37.40c and maximum mean temperatures of 450c. the average total yearly precipitation is approximately 100 mm and occurs mainly between October and April.
Kuwait's desert environment is characterized by several recent sedimentary layers, including eolian, residual, sabkha desert plain slope and costal deposits. Eolian deposits are the most predominant and account for more than 50% of al the surface deposits (Khalaf and Al-Ajmi, 1993). Kuwait's vegetation consists of undershruds, perennial herbs and spring ephemerals, with the vegetation types controlled by four major landforms (i.e.,sand dunes, desert plain, desert plateaue, and salt marsh and saline depressions; Halwagy and Halwagy, 1974). The major plant communities are (a) Cyperus conglomerates, (b) Rhanterium epapposum, and (c) Halaxylon salicornica, with the first two being predominant.
Shown in figure 1 is the location of the major onshore oil fields in Kuwait. The majority of Kuwait petroleum reserves are confined to the Greater Burgan oil field (subsequently referred to only as the Burgan, oil field), consisting of the Burgan Ahmadi and Magwa oil fields, and are estimated at 70 billion barrels of oil. The onshore Burgan oil field, Kuwait's largest producer is the second largest Ghawar oil field. Raudhatian Kuwait second largest onshore oil field, has proven reserves estimated at 7.5 billion barrels. The remaining oil barrels of have the following estimates in billions beharah 1.5, Umm Gudair 0.5 (Arab Oil and Gas Directory, 1992). Kuwait's other onshore oil fields such as Wafra, South Umm Gudair and South Fuwaris are located the partitioned zone that is equally shared with Saudi Arabia. Approximately 50% of the oil lakes by area, and Burgan oil field. In this study we utilized that were acquired between 1987-1995.
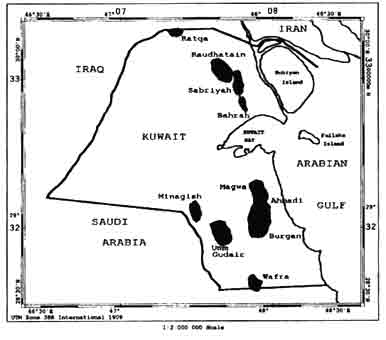
Fig. 1 Location of Kuwait's onsore oil fields
Methodology
The satellite images were all registered to the universal transverse and merctor (UTM) zone 38 projection and coordinate system , using a second order polynomial resampling scheme and bilinear interpolation. The Landsat TM and SPOT images were mosaicked to show synoptic views of Kuwait in 1989,1995. Landsat TM bands 2,4 and 7 color composite images were created for the there different years; however, only black because of publication restrictions. The individual bands were enhanced by using;
- A large high pass (HPF)filter of kernel size 201 * 201
- Addback of the original image to the HPF data, and
- Application of a 7*7 edge enhancement filter to sharpen the local
/textural high frequency information (Kwarteng and Chavez, in
press)
Image analysis were performed at the Remote Sensing Laboratory, Kuwait Institute for Scientific Research (KISR) usin UNIX- based PCI image processing software (PCI Inc.,1997).
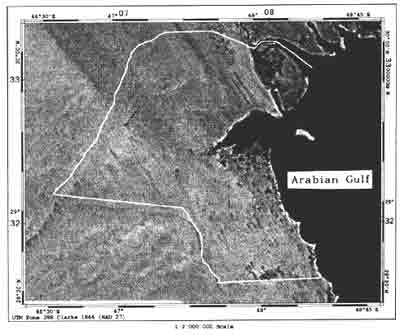
Fig. 2 A mosaicked Landsat TM band 7 image of Kuwait, June 1989
Discussion of Results
Figure 2, A mosaciked Landsat TM band 7 image acquired in June 1989, shows pre-oil spill conditions in Kuwait. The only significant oil spill when the image was recorded was the Wafra oil field. Figure 3 is a SPOT panchromatic mosaicked image showing the extent of the oil lakes and contaminated areas in 1992. The black area on land represented oil lakes, tarmats and soot at oil fields and environs. From 1992 TM image Kwartent (in press), calculated the thick soot to be 1,722 km2, representing approximately 10% of the total surface area of the State of Kuwait.
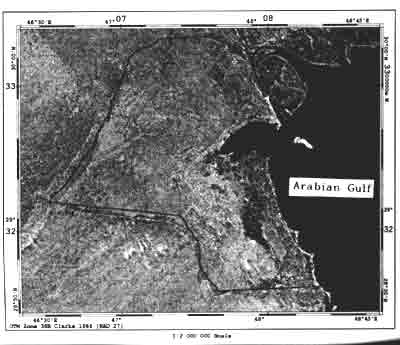
SPOT panchromatic mosaicked image of Kuwait, March 1992
Figure 4 depicts a mosaicked TM band 4 image of Kuwait in March 1995. The total area coverd by oil lakes, tarmat and dark contaminated soil the 1995 TM image was 398 km2. That represented approximately 77% reduction in the area compared to the 1992 TM image data. In most place, the soot or concealed soil remained in the soil and concealed under a veneer of sand that was why they were not observed on the satellite image. Kuwait experienced higher than average rainfall during 1992-1996, which was responsible for the relatively high vegetation density and distribution fo rpernnial and ephemerals plants in the desert area. The high rainfall coupled with low sand movement helped the area to shoe remarkable resilience four years sfter the oil lakes event. From March 1995 Landsat TM imagery the total area of lakes was 38.93 km2 (Kwareng in press). The breakodown was as follows: Burgan 35.45 km2, Wafra 1.77 km2, Raudhatain and Sabriyah 1.29 km2, and Umm Gudair and Minagish 0.42 km2.
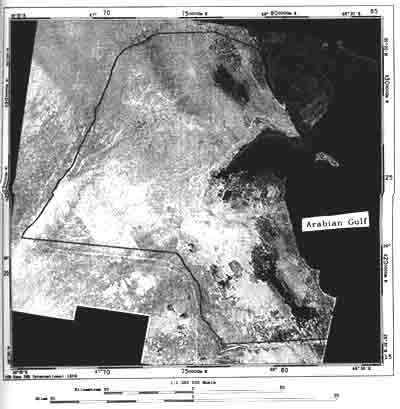
Fig. 4 A mosaicked Landsat TM band 4 image of Kuwait, March 1995
Figure 5 shows Landsat TM band 4 image of the Burgan oil field in 1987,1991,1993 and 1995. The four images have been registered to the UTM sustem to facilitate their comparison . figure 5A shoes pre-war conditions recorded on February 4, 1987; whereas Figure 5B depicts the same area on November 14,1991, when majority of the area was transformed into poola of oil wells. In Figure 5C acquired on February 28, 1993, most of the soot were not observed on the surface due to the action of sand encroachment and obscuring by vegetation. The oil lakes appear as dark cicular features. Landsat TM band 4 image of the Burgan in th espring of 1995 was the highest for the four years and helped in obscuring some of the contaminated areas. Most
of the soot had disappeared and were on observed on the surface in satellite images; however the oil lakes, and tar mats were still visible.
Conclusions
Analysis of land sat TM and SPOT images acquired between 1987 and 1995 showed that most of the contaminated areas could support vegetation in the presence of adequate water.
The exception to that was the surface of the oil lakes, tar mats and soot calculated
From 1992 land sat TM imagery the area calculated was 398 km2, representing 77% reductions in the area compared to 1992.However majority of the soot that later turned the soil black , remained in the soil and were concealed under a veneer of sand . the total area of oil lakes digitized from the 1995 TM images was 38093km2.Of that 35.45km2,or 90% was observed in the Burg an oil field . the area calculated represented a 20% reduction in the area reported in 1992. the shrinkage and concealment of some of the oil lakes is attributed to the recovery some of the oil , drying up of the shallow lakes over times, and sand encroachment . Most of the contami -nated areas have been fenced off and are not easily accessible to humans and animals . Nonetheless the risk to the environment remain and require continuous monitoring using several techniques .
References
- Arab Oil and Gas Directory ,1992. Kuwait. Arab petroleum Research
Center , Paris
- Balba ,M.T.;AL- Awdi, N,; AL-Daher R,; Chino,H.; and Tsuji,h.; 1996.
Remediation and rehabilitation of oil lake beds in Kuwait ; I
Bioremediation of oil contaminated soil in proceedings of the symposium
of restoration and Rehabilitation of the desert environment
- Kuwait ,3-4-March .Editors A.Al - Awadi, M.T . Balba and C. Kamizawa, Elsevier, Amsterdam , pp 21-40.
- Halwagy , R ,and Halwagy, M(1974) Ecological studies on the desert
of Kuwait part II . The vegetation, Journal University Kuwait (science)
1:87-95
- Khalaf , F.I , and AL-Ajmi, D.,1993. Aeolian processes and sand encroachment problems in Kuwait , Geomorphology. 6:111-134
- Kawarteng , A . Y. Multitemporal remote sensing data analysis of the
Kuwait oil lakes, Environment International (in press).
- Kwarteng , A.Y., and Chavez , Jr P.S. Mapping and change detection
study of Kuwait City and environs using multitemporal land sat Thematic
Mapper data , inter national . Jouranal of Remote Sensing (in
press).
- PCI Inc., 1997. EASI / PACE , version 6.1,PCI Inc ., Richmond Hill,
Ontario, Canada.
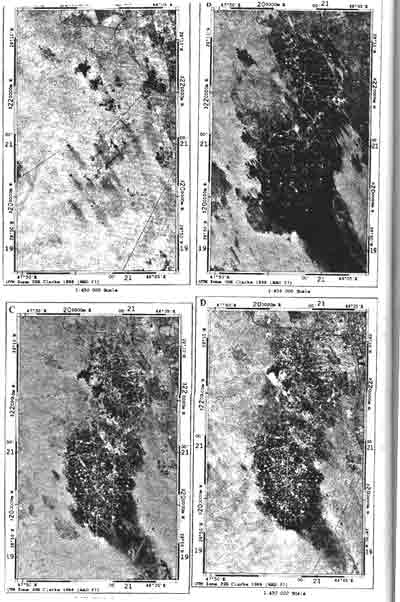
Fig. 5 Landsat TM band 4 image of Burgan oil field, (A) February 4, 1987, (B) November 14, 1991, (C) February 28, 1993 and (D) March 30, 1995