| GISdevelopment.net ---> AARS ---> ACRS 1997 ---> Disasters |
Detection of Fog and the Low
Stratus Cloud at Night Using Derived Dual Channel Difference of NOAA/AVHRR
Data
Hye-Sook Park, *Yeoung-Hwa
Kim, Ae-Sook Suh, and *Hee-Hoon Lee
Remote Sensing Research Lab. Meteorological Research Institute #2 Waryong-dong,
Chongno-gu, Seoul 110-360, KOREA
*Observation (Satellite) Office, Forecast Bureau, Korea Meteorological Administration
#1 Songwal-dong, Chongno-gu, Seoul 110-757, Korea
Tel. 82-2-747-7841 Fax. 82-2-3672-8063
E-mail: hspark@iris.metri.re.kr, suh@iris.metri.re.kr
Abstract
A method of detecting fog and the low status could at nigh is an example of using the infrared images of different wavelengths. It uses the property of emissivity of the infrared radiation. At about 11mm. the opaque cloud composing of water droplets has an emissivity of almost one, but at about 3.7mm they have the values of emissivity of about 0.8-0.9. Therefore the measured brightness temperature is significantly different.
In this study, the Dual Channel Difference (DCD) satellite imagery has been derived from the linear difference of brightness temperature between the two infrared window channels of NOAA AVHRR data. To improve the height assignment of the cloudy pixel over data-sparse regions, radiosone data at Osan has been used 7x7 pixel averaging has been applied eliminate unwanted cloud features. The empirical cut-off thresholds determined from DCD imagery.
Introduction
The detection and short range forecasting of fog and low status clouds at night pose many difficulty is to aviation and marine meteorologists. The number of surface-observing sites over land and ocean is not sufficient to determine the true areola extent of fog. Because of the low density of these surface observations, remote-sensing techniques must be used to determine the areola extent of fog and low status especially at night.
Detection of fog during the daytime is relatively straightforward from the convenient visible and infrared images. Areas of fog and low stratus are easily distinguished at daytime from satellite images because they are characteristically bright in the visible images. The reason is that they strongly reflect solar radiation and their temperature is warmer than that of the other clouds at visible wavelengths. However it is difficult to detect them during the nighttime on image because visible images are not available and the thermal contrast between the fog and the surface is usually very small in general. Fog and surface is expressed similarly because their thermal contrast is very small in infrared images. So the variation of fog emissivity in the range of infrared wavelength has been used to distinguish it from the surface of land and sea from the infrared images only.
Eyre et al. (1984) described a new technique for the detection of fog at nigh using two infrared channels, channel 3(3.7 mm) and channel 4(11 mm), of the National Oceanic and Atmospheric Administration(NOAA) Advanced Very High Resolution Radiometer (AVHRR). However, this method is not sufficient to detect effectively the fog and low cloud because observations of polar-orbit satellite are 4 times a day and not regular every day. So, Ellrod (1989, 1991, 1994,1996) used two channels on Geostationary Operational Environmental Satellite (GOES) which can monitor every hour. Using the difference of the brightness temperature of two channels that is often called dual channel difference (DCD), they describe the characteristics of various clouds (cirrus, fog, low cloud).
In this study we obtained the DCD from channel 3 and channel 4 of the AVHRR, and as-singed the height at each pixel using upper observation data to separate the fog and the low cloud area exactly from the background field. We used the averaged pixel data to eliminate the properties of unwanted low clouds.
Data and Method
Data
In this study, the channel 3 and 4 of NOAA 12 and 14 received from KMA (Korea Meteorolocical Administration) satellite office was used. Data area is consisted of 1024 pixels X 1024 temperature of channel 4) was calculated by manipulating the temperatures obtained from the conversion table for each channel. The upper radiosonde data was used for detailed altitude division over data-sparse region, and the average of some pixels was used as representative value to exclude the features of the unwanted clouds on the sea and the land. The observation data of fog at seventy-one stations was used for the verification of each case. Fog was defined when visibility did not exceed 1km.
Method
Infrared wavelength range of NOAA/AVHRR is channel 3 (3.7 mm), channel 4 (11 mm), and channel 5 (12 mm). The cloud top temperature observed by satellite is almost the same as the real top temperature of clouds because the emissivity of the opaque water cloud is one around 11 mm, So it radiates almost the same as black body does. In addition, the observed cloud top temperature around 3.7 mm is lower than the real temperature, because they have an emisivity of about 0.8-0.9 around 3.7 mm, which is lower than one.
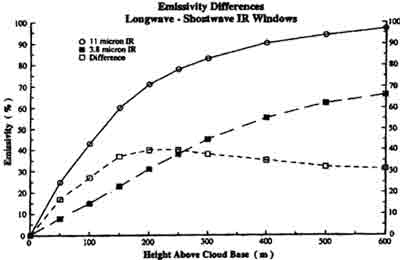
Fig.1. The variation of emissivity (%) of the stratus-cumulus cloud of water content 0.1 gm-3 for increasing height above the cloud base (m). Emissivities are shown for Longwave (LW) IR channel (11 mm), the shortwave (SW) channel (3.8 mm) and the difference between the two (Hunt, 1973).
Like Fig. 1, which indicates the quality of emissivity(Hunt, 1973), the thinner the thickness of clouds, the smaller emissivity and the bigger error in the two wavelengths, but there reveals the fixed value over a certain thickness. However this quality doesn't appear in the sea surface and land, so we can use DCD image to distinguish fog from other clouds. Table 1 expresses the DCD quality value (Ellorod, 1996) obtained by experiences in GOES-8.
| Feature | Threshold |
| Bare ground | -2.5 <DCD> <-+2.5 |
| Low Stratus | +2.5 =DCD> <+9.5 |
| Cirrus | DCD < -2.5 |
Result
The DCD threshold value of NOAA, obtained from the experience of the five cases, is the same as Table 2.
| Feature | Threshold |
| Low stratus | -9.5 <DCD> <-3.0 |
| Bare ground | +3.0 < DCD> <+2.5 |
| Cirrus | +2.5 > DCD |
DCD image represented the raw data in the altitude over 700hPa and expressed by false color to distinguish one layer from the other layer (surface-8500hPa, 850-700hPa) below 700hPa. In addition, black boxes (?) are marked at the stations where fogs are observed for variation gauge.
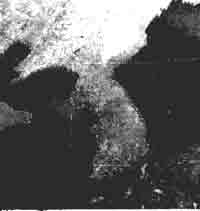
Fig 2. NOAA-14 Channel 4 image for 1731 UTC 17 November 1995
As Fig.2 is an image representing raw data from a satellite, low stratus are formed widely over the western sea, and cell type clouds are distributed over the southern sea. Yet, it is difficult to know the existence of low clouds exactly, even though there are the gaps of light and darkness caused by the temperature difference of seawater over the eastern sea.
In Fig. 3, DCD image which doesn't average pixel values, the pixels having the quality of fog and low clouds between land and 850 hPa are expressed with the orange color, and the pixels ranging between 700hPa and 800hPa are indicated with green color.
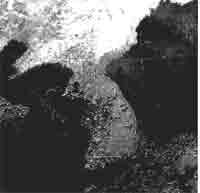
Fig. 3. NOAA-14 DCD image not averaged For 1731 UTC 17 November 1995.
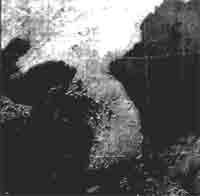
Fig.5. As in Fig.4. except for 7x7 averaged
In conclusion, the low cloud area is shown delicately between over the land and at 700hPa over inland according to the properties of the surface. However quantities of unwanted cloud such as noise and cell type clouds are misprinted as low cloud area. When around the top of Mt. Han-La, the pixel threshold value appears differently from the real altitude because pixel, thresh old value ranges between land and 800hPa
Fig. 4 is the DCD image composed of the 7 x7 averaged pixel. The figure shows that the characteristic of abnormal low clouds on the sea is eliminated by the effect of smoothing. On the other hand, it is difficult to decide exactly the range of fog or low clouds, because the smoothing effects neglect the low clouds reflecting the geographical the geographical features and the fog occupying narrow area.
The result of this study is as follows. DCD images with the 1.1 km resolution shows the exact range of fog and low clouds over the mountain and sea where observations and very limited. Even though the upper observation data of Osan is used to assign the height of each pixel the more exact method giving the height seems to be necessary because the regions of sea and mountain shows much severe errors than other region. For example, some pixels of the DCD image is interpreted as fog over the regions of warm sea and low latitudes because the altitude of for or low clouds is lower than that of the observed value according to the temperatures. On the contrary, other pixels of the DCD image is interpreted as low clouds in the mountain area because the altitude of the fog or low clouds is higher than the observation values of the Osan according to the temperature. So it is difficult to know the exact height of them Meanwhile, the 7 x7 aver-aged pixels value may be used to eliminate the quantities of unwanted low clouds such as noise and cell type clouds. The smoothing effects eliminate the pixels of the abnormal low clouds to some extent over the sea. But some ill effects of neglecting the low clouds coming from the geographical features and the fog occurring in a very small region have introduced.
Conclusion
In this study, we used the emissivity of the water clouds at different IR wavelengths to detect exactly the distribution of fog and low clouds occurred during the nighttime. We obtained the DCD image to get the threshold value using the channel 3 and 4 data of NOAA/AVHRR. In addition, we assign the height for each pixel using the temperature of the standard pressure level from the upper-air observation data of Osan. We employ the 7x7 averaged pixels values to eliminate the qualities of abnormal low clouds such as noise and cell type clouds. We computed the area of the fog and low clouds with the same threshold value in the reproduced DCD image based on the representing values empirically and expressed the original quantities of the clouds as false color below 700hPa and by shown raw data above 700hPa by assigning of the altitudes from the brightness temperature. As a result, we can distinguish exactly the regions of fog and low clouds over the land and sea. Yet our method introduce errors in the latitude assignment for each pixel and produce the undesirable effect to vanishing the low cloud region which is reflecting the geographic feature over land. So we must reduce the error range of the threshold value in representing the range of fog and low clouds in the DCD representation value to better result. And we have to accumulate. The more accurate altitude assignment method such as using the data from numerical forecasting pixel values may be necessary to obtain the image representing the distribution of the real fog and low clouds. An exact mean pixel value is important to eliminate the quantities of abnormal low clouds. In future, we will produce the DCD representation value based on the channel 3-channel 4, channel 3-channel 5, and channel 4-channel 5 through the theoretical considerations and more case studies.
Reference
- Ellord, GP.P., 1991: Nighttime fog detection with bi-spectral
GOES-VAS imagery. Proceedings, Fourth International Conference on
Aviation Weather Systems, May 24-28, 1991, Paris, France. Amer. Meteor.
Soc., Boston, 71-75.
- --------, E. Maturi, and Lt(jg) J. Steger, 1989: Detection of fog at
night using dual channel GOES-VAS imagery. Proceedings, twelfth
Conference on Weather Analysis and Forecasting, October 2-6, 1989,
Monterey, California, Amer. Meteor. Soc., boston, 515-520.
- --------, 1994; Detection and analysis of fog at nigh using GOES
multi-spectral infrared imagery NOAA Technical Report NESDIS 75,
22pp.
- Eyre, J.R.J.L. Brownsombe, and R.J. Allam, 1984 : Detection of fog
at night using Advanced Very High-Resolution Radiometer (AVHRR) imagery.
Meteorological Magazine, 113, 265-271.
- Hunt, G.E., 1973 : Radiative properties of terrestrial clouds at
visible and infrared thermal window wavelengths, Quart. J. Royal Meteor.
Soc., 99, 346-369.
- Nelson, III, J.P. and G.P. Ellrod, 1996; Improved GOES-8
multi-spectral (10.7mm-3.9mm) satellites imagery to detect stratus and
fog at night. Proceedings, the 8th Conference on Satellite Meteorology
and Oceanography, Jan28-Feg 2, 1996 Atlanta, Amer. Meteor. Soc., Boston,
172-176.
- Nelson III, J.P. and G.P. Ellrod, 1996; Screened GOES -8 multispectral (10.7mm-3.9mm) satellites imagery to detect stratus and fog at night. Proceedings, the 15th Conference on Weather-Analysis and Forecasting, Aug 19-23, 1996 Norfolk, Amer. Meteor. Soc., Boston, 40-43.