| GISdevelopment.net ---> AARS ---> ACRS 1997 ---> Disasters |
Flood Monitoring in Central
Plane of Thailand Using JERS-1 SAR Data
Kiyoshhi Honda, Francis X.J
Cannisius and Bhuwneshwar Prasad Sah
STAR/SERD,Asian Institute of Technology,
P.O.Box 4,Klong Luang, Pathumthsni 12120, Thailand
Tel:+66-2-524-6149, Fax:+66-2-524-6147
E-mail: Honda@ait.ac.th
AbstractSTAR/SERD,Asian Institute of Technology,
P.O.Box 4,Klong Luang, Pathumthsni 12120, Thailand
Tel:+66-2-524-6149, Fax:+66-2-524-6147
E-mail: Honda@ait.ac.th
In central plane of Thailand, particularly rainfall occurring during September has often resulted in floods with damaging inundation. As radar remote sensing can provide images during day or night and presence of clouds or light rain, its application has received more attention in this regard. For this study, 33 JERS-1 SAR scenes of May, September and November 1995 were selected. First a detailed analysis of JERS-1SAR data of May 1995 with Land sat TM data was executed. Processing and classification of September and November imageries for flood area mapping followed this. After overlay among the four- date classified image, the actual open flooded area. Flood affected area and flood movement had been extracted successfully. The results have shown a real possibility to apply JERS -1 SAR data for flood mapping and monitoring. However, for accurate analysis, field measurements remain indispensable.
Introduction
Among the several types of dissters, flood disaster is wordwide natural phenimena especially in flood plain like Chao Phraya basin in central, Thailand. Terrain characteristics of land and meteorological properties of the region are main natural factor for this disaster. . Such disaster is enhanced by the human activites on land, like construction of faulty infrastructure, deforestatio, faulty agriculture etc. Although, each year this region experiences flood disaster, damage extent was biggest in 1995 one after 1989 (Tawatchi, 1996).
To mitigate the flood disaster, timely information regarding flood extent, safe area, way to escape, probable countermeasures etc. are essential factors. As the areal coverage of central plain of Thailand is huge one, to get such information through traditional way is difficult. This calls to use of some advance technology, like remote sensing, for timely monitoring and short term as well as long term planning. Most of the time cloud and rain remain active during the flood, possibility to use of optical remote sensing is less. As the microwave remote sensing can collect in the huge area, like central plain of Thailand, is an important tool. Under these circumstances, this study has been done with following objectives:
- To estimate the actual open flood area of year 1995,
- To delineate the flood movement between September and November
and
- To evaluate the flood affected area.
Central plain of the Thailand, including Bangkok metropolitan, is the study site for 1995 historical flood. The Lower part of Cho Phraya and Tha chin river, which drain in to the gulf of Thailand, basin formed this plane. Geographically it located between latitude 13oC 15'25" to 15oC 10'24" and logitude 99oC 46'53" to 101oC 19'31" and cover an area of 35, 532 sq. km. Administratively, this province Changwat Singburi, Lopburi, Suphanburi, Anghong, Saraburi, Ayutthaya, Nakorn Prathom, Nonthaburi, Phathumthani, Nakorn Nayok Bangkok, Samutsongkham, Samutsakhon and Samutphakan and some part of other provinces (Map1). Flat topography, the average elevation less than 2 meter from mean sea level, is the result of the alluvial flood soil deposition of its main rivers. Land is composed from three main landforms, which are active tidal flat, former tidal flat with recent marine and brackish water deposits and former tidal flat with older brackish water deposits. It has tropical monsoon climate with average temperature in the range of 27.90 to 28.30 and rainfall in the range of 980 to 1200 mm. Most of the rainfall is concentrated during the month of August to November, where most of the time tropical storms also occur. On an average the number of such storms in Thailand is 3.7 per year (Untied Nation, 1984). The area is densely populated along with intensive commercial and agricultural activities, where development of national and international transportation links are in considerable volume.
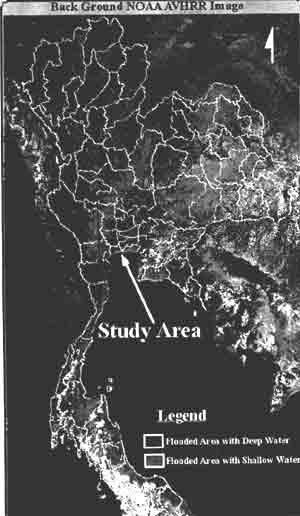
Map 1: Location Map of the Study Area
Data Used
JERS-1 SAR imagery were the fundamental source of information in the framework of this study where Landsat TM data were used as the base map. Thirty-three scene of JERS-1 SAR along with 3 scene of Landsat TM data had been used. The description of used data sets are given in Table 1.
JERS-1 is an earth observation satellite, placed in space at 568 km altitude in Sunsychronous Subrecurrent Orbit with 44 days of recurrent period (JARS, 1993). Its was launched by the H-1 rocket on February 11, 1992 from Tanegashima space Center, NASDA, and has kept observing global data by the high performance Synthetic Aperture Radar (SAR) and Optical Sensor, which (OPS). JERS -1 SAR is an active sensor, which transmits microwave (1.275 GHs, L-band frequency in HH polarization) and receives back-scattered waves from the target to observe their characteristics, provided all weather capability. The incidence angle is 38.5o to the center of the 75 km wide swath and the ground resolution resolution is 18 m x 18 m. (3 looks). It achieves fine resolution in the pulse compression technique and in the azimuthal direction relied on the synthetic aperture technique.
| Satellite & Sensor | Season | Date of Acquisiton | No. of Scene | Path/Row |
| JERS-1 SAR | Dry | 15-May-95 | 11 | 126/275, 276,277,278, 127/275, 276, 277, 278 128/275, 276, 277 |
| Wet | 25-Sep-95 | 11 | do | |
| Wet | 7-Nov-95 | 11 | do | |
| Lansdst TM | 21-May-95 | 3 | 129/49,50,51 |
SAR image presents different grey levels related the relative strength of the microwave energy backscattered by the landscape elements (Ulaby et al., 1982). The intensity of the backscattered signal varies according to the roughness, dielectric properties and local slope. High intensity returns appear as light tones on positive image, while low signal returns appear as dark tones on the imagery (Dautrebande et al, 1994).
Methodology
The imageries wee processed in four steps to obtain the results for flood inundation mapping and monitoring. These steps are:
- Pre-processing of JERS-1 SAR and Landsat TM imagery
- Reduction of speckle in JERS-1 SAR imagery
- Identification and mapping of flood inundated areas and
- Flood inundation monitoring
To remove the speckle noise, which is system phenomenon and is not result of spatial variation of average reflectivity of the radar illuminated surface, two methods (FAO/ESA, 1989): SAR image multi-look processing and filtering techniques can be used. It is latter method that has been used in this study.
Flood inundation mapping is based on the fact that water will normally appear black in a SR image, that is minimum radar echo (Dallemand et al., 1993) This principle is used as the guideline for this study. Flood monitoring is the change detection before and after inundation. This change can be detected by differencing and rationing technique as suggested by Singh, 1989 and overlaying of classified imagery. In differencing, changes in radar backscatter are measured by subtracting the intensity value of pixel between two dates, while in rtioning, instead of subtraction, ratio is taken. Overlaying of classified image is one type of change detection technique which can be used to find out the spatial land cover difference of two dates. In this study all three technique were tried and last method was adopted.
From the May 15 JERS-1 SAR the areal coverall of permanent water body was extracted, while sep. 25 JERS-1 SAR and Nov. 7 JERS-1 SAR used to extract to extract the open flooded area. Then the actual open flooded area and flood movement was estimated by overlaying. To extract the base map from Landsat TM data, May 15 JERS-1 SAR data was also used for classification of land of land cover. This map was used to detect the flood-affected area. The output from these analyses can be used for the monitoring of the flood. The overall methodology has been presented in Fig.1.
Figure 1: General Methodology to Estimate Flood Affected Area and Flood Movement
Result and Discussions
Base Map Preparation
The base land cover map had been prepared by using Landsat TM data JERS-1 SAR data of 15 May. The use of SAR data increase the classification accuracy, especially for Urban and Wet Land land cover types. The selection of legend for the classification is decided on the basis of the damage where the direct concern of human is experienced. The legend " others" is the Land cover types which cover forest, plantation, and sea etc. The real converge of each land use type is presented in table 2.It shows the paddy field occupied the highest percent of land area
Actual Open Flooded Area
The area coverage of the study area is bigger than the listed provinces. All together fourteen provinces are covered fully while there are some other provinces that are not covered fully and not listed here. Thus total area is 15.94 percent for whole study area (Table 2), while in listed fourteen provinces it is 18.38 percent (Table 3).
Flood Affected Area
After overlaying the actual flooded area with land cover base map, the flood-affected area had been obtained. Table 2 gives the picture of the flood-affected area by land cover types. The effect of flood is highest in wetland and lowest in upland. The flood had affected around twenty percent of urban area, which is significantly high. Naturally this is matter of concern and any flood protection should be directed to this area on priority basis.
The flood-affected area for each listed province was also calculate and presented in Table 3. Here, the affected area from flood is not listed according to land cover type rather it is present overall for each province basis (Table3). The affect of flood is the lowest in Lopburi province and highest in Ayuthya. This information can be used to plan the flood protection plan for the provinces. The provinces can be grouped into the priority basis. Table 4 shows such priority. Map 2 shows the distribution of flood in study area.
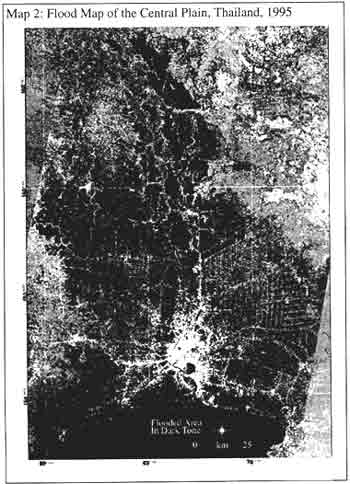
Map 2: Flood Map of the Central Plain, Thailand, 1995
| Land cover type | Total Area (sq.km) | Flooded Affected Area (sq.km.) | Flooded Affected Area(%) |
| Wet land | 2187.33 | 1107.72 | 50.64 |
| Paddy | 15073.14 | 3444.12 | 22.86 |
| Upland Crop | 6984.95 | 714.80 | 10.23 |
| Urban | 2012.69 | 396.26 | 19.69 |
| Others (forest, Plantation, sea etc) | 9273.89 | - | - |
| Total | 35532.00 | 5662.90 | 15.94 |
Flood Movement
Flood Movement is the one of the important event during flood season in different months. The extent of movement and their formulation of the maximum movement should be taken into account in Such consideration. A significant flood movement had been observed between the month of September and November.
| Province name | Total Area (sq.km.) | Flooded Affected Area(sq.km.) | Flooded Affected Area(%) |
| Singuri Lopburi Suphanburi Angthong Saraburi Ayuthya Nakorn Prathom Nonthaburi Pathumthani Nakorn Nayok Bangkok Samutsogkham Samutsakhon Samutphakan |
844.00 6704.75 5319.77 955.86 2929.03 2556.93 2133.39 637.51 1523.71 2160.48 1589.21 402.99 862.74 952.15 |
231.22 632.89 876.73 322.54 323.21 062.85 393.07 113.76 394.19 217.93 283.49 76.07 269.52 238.99 |
27.40 9.44 16.48 33.74 11.03 41.57 18.42 17.84 25.87 10.09 17.84 18.88 31.24 25.10 |
| Total | 29572.51 | 5436.45 | 18.38 |
Recommendation
Monitoring of flood disaster by using the update information from using remote data sensing JERS-1SAR is the important to minimize the damage with proper protection measure. Protection for the urban area should be paid ample attention followed by wet land area. For provincial level protection program, priority should be given by using Table 4. By using this technique and method, regular basis monitoring is recommended in future.
| Protection priority | Range (%) | Provinces Name |
| Very high | >30 | Samutsakhon, Angthong and Ayuthya |
| High | 20 to 30 | Samutphakan, Pathumthani, Singburi |
| Moderate | 10 to 20 | Sarburi, Suphanburi, Bangkok, nonthaburi, Nakon Prathom, Samutsongkham |
| Low | up to 10 | Lopburi, Nakorn Nayok |
Conclusion
As the flood disaster occurs on regular plain of Thailand, effective and timely information regarding inundation and their effect are essential for proper disaster prevention program. Being weather independent, microwave remote sensing can provide such information. By using thirty-three scenes of three date JERS-1 SAR and three scene of Landsat TM data, the actual open flooded area, flood affected area and flood movement had been successfully extracted. The use of JERS-1SAR data along with Landsat TM data for base map of land cover is encouraging. The extracted information can be used for the flood management and monitoring perpose. Finally it can be said that JERS-1 SAR data has great potential for extracting information, such as inundation and their effect, for flood disaster prevention.
References
Dallemand J.F. Lichtnegger J.,Raney R.K. And R.Schuman(1993), Radar Imagery : Theory And Application, Lecture Notes FAO Remote Sensing Center Rome Italy.
- Dallemand J. F., Lichtnegger J., Raney R. K. and R. Achumann (1993),
Radar Imagery; Theory and Application, Lecture Notes, FAO Remote Sensing
center, Rome Italy.
- Dautrebande, S,Badji, M.,Mokadem, A.I. And A.Dewez (1994), ERS-1SAR
Imagery Applied To Rural Basins Hydrological Studies I:flood Inundation
mapping and monitioring, Proceding of the first Worksshop on ERS-1 pilot
projects,22-24 June,1994, Toledo, spain
- FAO/ESA (1989), Principle Of Radar Imagery, Fao Remote Sensing
Series No.46
- Jars (1993), Remote Sensing Note Japan Association On Remote Sensing
(JARA),IIS, Univ. of Tokyo, Japan Digital Change Detection Techniques
Using Remotely Sensed Data International Journal Of Remote Sensing,
Vol.10(6):989-1003.
- Tawthchai, t. (1989), Floods And Human Interaction Experiences,
Problem And Solutions, Professional Inaugural Lecture, Sep. 19,1996,
AIT, Bangkok, Thailand
- Ulaby, F.T., More, R.K. And A.K. Fund (1982), Microwave Remote
Sensing: Active And Passive, Vol.2, Reading, Massachusets :
Addison-Wesely.
- United Nations (1984), Damage information compilation System in the
Typhoon Committee Region, Bangkok,
Thailand