| GISdevelopment.net ---> AARS ---> ACRS 1997 ---> Agriculture/Soil |
Spatial Modelling of Soil Alkalinity in GIS Environment Using IRS Data
Nitin Kuamr Tripathi, Brijesh Kumar Rai and Praveen Dwivedi
Geoinformatics Division
Department of Civil Engineering
Indian Institute of Technology
Kanpur-208 016, India
Tel : 0091-512-597722, Fax:0091-512-5907305/590 007
E-mail: mailto:nitin@iitk.er%20net.in
Abstract
Soil salinity is a serious problem encountered in over-irrigated areas. It hampers crop production adversely and reduces the utility of the land for Many Civil Engineering projects also. An attempt has been made to estimate soil salinity quantitatively and also spatially. IRS-IB LISS II data in four bands has been used. Field work has been conducted to collect samples and chemical analysis in laboratory has been carried out to determine alkalinity. This data is attributed in GIS environment of ILWIS 1.41 to the digitized map. An integrated an of remote sensing and field data has been conducted in GIS to map alkaline zones and determine the alkalinity levels for November 1992 and April 1993.
Introduction
Over-irrigation due to poor management of canals, reservoirs and also presence of other surfaces steams causes water-logging and results in severe salinity of soils. It hampers the land use for agricultural purposes as well as for many Civil Engineering projects. Salt affected soils cover seven million hectares of 328 million hectares of India's total land area ( Dwivedi, 1992). An attempt has been made in this paper to integrate remote sensing, digital enhancement and geographic information system to estimate quantitatively the alkalinity levels of soils and determine its spatial extent. Two new indices, salinity index (SI) and normalized difference salinity index NDSI) have been proposed to highlight the alkaline zones of the soil.
Detailed field sampling has been conducted for determination of the soil alkalinity using chemical laboratory tests and analysis. Field data results have been attributed to the digitized sampling point map of the study area in ILWIS 1.41 environs along with satllite data of four spectral bands and topographic map obtained from Survey of India. The huge database generated in GIS habitat been used in spatial modeling. This approach has yielded maps displaying alkalinity levels in November, 1992 and April, 1993. Finally, the changes in levels and spatial extent of alkalinity has been estimated. The results obtained has been verified by field checks. This approach may be utilized to delineate soil alkalinity and monitor seasonal variation effectively. This will be useful tool for field engineers to manage irrigation network properly and protect the agricultural lands from problems of soils alkalinity.
Study Area and Data Used
The study area is situated within the alluvial Gangetic plains near Kanpur, India. This area is characterized by dense network of canals and surface streams, which has imposed problems of over-irrigation and water-logging. Due to this, soil has developed high concentration of salts, which has adversely affected the agricultural land. Ground water table in general is high and water quantity is good. The climate of the area is semi-arid, sub-tropical and monsoon type. Water is available in abundance for irrigation in this region.
Topographic maps of Survey of India used in this study are 63B and 63B/2. To evaluate seasonal variation in extent of salinity, data of IRS-1B LISS II in all four bands (Band 1 : 0.45 - 0.52 mm, Band 2 : 0.52 - 0.59 mm, Band 3 : 0.62 -0.68 mm, Band 4 : 0.77 - 0.86 mm) is used for two different periods namely : November 1992 and April 1993. These particular months have been chosen because of considerable variation in soil salinity.
Table 1: Description of the sampling zones
| Sampling Sites | Description of sites |
| 1,2,6,19,20 | Normal soils, These areas are in general have no significant effect of salt on the soils. |
| 3,4,5,8,9,14,18 | Soil moderately affected with salt, but the salt has not come above the ground at the time of sample collection. |
| 7,10,11,12,13,15,17 | The soil is severely affected by salt, salt can easily seen on the ground. |
Methodology
The work consisted of field sampling chemical analysis in laboratory, regression analysis and GIS assisted spatial modeling.
Field Sampling and Laboratory Analysis
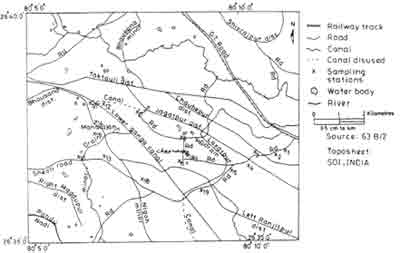
The sampling sites are shown in Figure 1 and location details are given in Table 1. Having a broad idea about the presence of various ions in the salt from earlier works on Indo-Gangetic plains and other areas ( Mougenot et. al. 1993, Rao et. al. 1991), chemical analysis is performed in the Table 2.
Salinity Indices
In order to enhance the saline zones and suppressing the vegetation, two indices : Salinity Index (SI) and Normalized Difference Salinity Index (NDSI) is proposed in this study. SI is the ratio of red band to near infrared (NIR) band while is the ratio of the difference of the red to NIR and divided by the summation of the two. This concept has emerged from the Red Edge concept for vegetation vigour mapping. In red edge concept, the spectral reflectance of NIR is radioed with red band which gives very high values for vegetation than other features on Earth. Here if the inverse is considered then for vegetation low values will be obtained thus suppressing the vegetation and highlighting the soil. SI and NDSI are computed as follows:
SI =(Band 3 / Band 4) * 100
NDSI =[(Band 3 - Band 4) / (Band 3 + Band 4)] *100
These are found useful than individual bands particularly in emphasizing saline soil regions.
Empirical Models Using Soil Alkalinity and Spectral Reflectance
The location map of the study area is dizitized under ILWIS 1.41 environs using ALTEK Datatab digitizer (A0). This map is georeferenced using control points present in images of different bands and the topographic map. This procedure has helped in identifying the location of sampling point sources on satellite data. The corresponding reflectance of soil samples from different sampling zones are retrieved for different bands. Empirical models for soil reflectance (SR) viewshed. alkalinity, and NDSI vs.alkalinity habitat been prepared using regression analysis:
Alkalinity (mg/L)=ar2 +br+c
Where a, b,c are regression coefficients and r is the spectral reflectance / salinity index / normalized difference salinity index. The models have been prepared for November 1992 and April 1993 data. The regression coefficients thus obtained for each of the models are listed in Table 3.
It has been observed that empirical model of spectral reflectance using band 3 vs. alkalinity habitat has offered high coefficient of correlation 79 for April 1993 images. This empirical model for band 3 has been extended for whole image and alkalinity levels are divided into six groups. The advantage of this model being generalized through GIS is that it directly gives the alkalinity level at any point in the image. The empirical models for SI vs. alkalinity and for NDSI vs. alkalinity on similar pattern have been developed. These empirical models have been applied on the complete area, which enhanced some new areas of high salinity and the same has been confirmed from selected field verification. The similar type of empirical models is generated for November 1992 image for observing the change in alkalinity level but it offered lesser coefficient of correlation for band 3 and for SI respectively. The NDSI model offered poor correlation for November 1992 image and it has not been considered. The reason for the decrease in the alkalinity in November period is just because of dilution of salt from the top cover of the soil due to rain. Due to this top few centimeters of the earth crust is devoid of the salt and farmers have been able to grow the paddy. In November the paddy crop is prolific and offers lesser scope to record soil signatures through satellite sensing. Thus the model for NDSI in November has yielded very poor result.
Zones of Salinity in the Region
NDSI image of April 1993 depicts that the biggest saline zone of the area occur between Pandu river and Lower Ganga Canal (Kanpur branch). The spread of this saline zone and similar other zones are observed. The empirical models generated have been used in spatial modeling and images of alkalinity have been generated for April 1993. Table 4 represents the areas covered by different zones of salinity of IRS-1B April image of the region.
Table 2 : Alkalinity of Soil Samples
| Site No. | Location | Alkalinity (mg/l) |
| 1 | Abdulpur | 190 |
| 2 | Chandika | 115 |
| 3 | Badi Purwa 1 | 550 |
| 4 | Badi Purwa 2 | 910 |
| 5 | Champatpur | 90 |
| 6 | Gauri Lakha 1 | 1090 |
| 7 | Gauri Lakha 2 | 1300 |
| 8 | Gauri Lakha 3 | 1220 |
| 9 | Bhagvat Pur | 1120 |
| 10 | Laxman Pur | 300 |
| 11 | Jagat Pur 1 | 770 |
| 12 | Jagat Pur 2 | 1390 |
| 13 | Maharaj Nagar | 490 |
| 14 | Manoh Bari | 930 |
| 15 | Manoh Choti | 780 |
| 16 | Bhausana | 1310 |
| 17 | DiLeep Nagar | 930 |
| 18 | Rautapur 1 | 780 |
| 19 | Rautapur 2 | 150 |
| 20 | Sheoli Road | 120 |
Conclusions
This study emphasizes that SI and NDSI may be used in place of individual bands to enhance the saline patches as it suppresses the vegetation. A regression analysis of SI vs. Alkalinity, SR vs. Alkalinity, NDSI vs. Alkalinity offers a polynomial relation of the order 2. In case of SI vs. Alkalinity, best coefficient of correlation is obtained. The models thus obtained are generalized using TABCALC module of ILWIS 1.41 and spatial map of alkalinity has been obtained. This helps to generate soil alkalinity spatial database which may be used in any GIS for future analysis and management of degradation of the land. From this study it is concluded that remote sensing data in GIS environs may yield very useful database of soil alkalinity. This may be utilized by soil scientists and field engineers.
Table 3 : Regression parameters for empirical modeling
| Month | Parameter | a | b | c | Coefficient of Correlation(%) |
| April 93 | SR(band3) | -0.0774341 | 26.723 | -764.525 | 79 |
| April 93 | SI | -0.04555 | 24.2837 | -1125.57 | 85 |
| April 93 | NDSI | -0.000937 | 4.88441 | 71.5361 | 84 |
| Nov.93 | SR(band3) | -0.140401 | -39.8994 | 2624.98 | 64 |
| Nov.93 | SI | -4947.95 | 5640.67 | -111.749 | 66 |
References
- Dwivedi, R.S., and Rao, B. R. M. (1992), "The Selection of best
possible Landsat-TM band combination for delineating salt affected
soils", International Journal of Remote sensing, Vol. 13,No. 11, pp.
2051-2058.
- Rao, B.R.M., Dwivedi, R.S.,Venkataratnam, L., Ravishanker, T.,
Thammappa, S. S., Bhargava, G.P., and Singh, A.N. (1991). " Mapping the
magnitude of Sodicity in part of the Indo-Gangetic plains of Uttar
Pradesh, Northern India using Landsat-TM data", International Journal of
Remote sensing, Vol. 12,No. 3, pp. 419-425.
- Mougenot, B., Pouget, M., and Epema, G.F. (1993). " Remote Sensing
of Salt Affected Soils", Remote Sensing Reveiws, Vol.7,
pp.241-259.
Table 4 : Area of different saline zones using different empirical models of IRS-1B data
| Class | Level (Alkalinity) | Area (habitat) in April 93 | Area (habitat) in Nov. 92 | |||
| Band 3 | SI | NDSI | Band3 | SI | ||
| 0 | Others | 885.7674 | 901.7982 | 895.8852 | 3180.0114 | 3254.7780 |
| 1 | V. Low | 3621.1212 | 3304.9728 | 3414.2976 | 10379.9430 | 8970.6780 |
| 2 | Low | 9151.4844 | 8173.3428 | 7888.2048 | 9279.8622 | 9960.3456 |
| 3 | Medium | 9018.3762 | 9217.71 | 9869.9796 | 5527.7352 | 5965.6914 |
| 4 | High | 5548.6278 | 6081.7176 | 5322.0942 | 1469.0520 | 1636.7184 |
| 5 | V. High | 1780.0758 | 2325.9114 | 2614.9914 | 168.8490 | 216.9414 |