| GISdevelopment.net ---> AARS ---> ACRS 1997 ---> Agriculture/Soil |
Temporal Analysis of Agricultural Land Use in the Semi Arid Trophics of India Using IRS Data
Satoshi Uchida
Environmental Resources Division
Japan International Research Center for Agricultural Sciences (JIRCAS)
I-2, Ohwashi, Tsukuba, Ibaraki 305, Japan
Tel: (81)-298,38-6355 Fax : (81)-298-38-6651
E-mail : uchidas@jircas.affrc.go.jp
Abstract
Indian Remote Sensing Satellite (IRS) data was examined to analyze temporal as well as spatial characteristics of agricultural land use in the semi-arid tropics of India. Because of the high probability of acquirement of cloud free data, one of the major cropping season, Rabi (post rainy), were selected to monitor its agricultural activity. In the Rabi season normalized vegetation index (NDVI) value of cropped area showed higher amount than that of forest and also those of other categories. The pattern of temporal change of NDVI of each land use category could be approximated as a linear decrease in the latter period of Rabi season. This formation was applicable to correct the difference of date of observation of satellite data to discriminate the cropped area from other land use by NDVI value. The results of application of this method showed that the cropped area in Rabi season had increased double in the period of 1989 to 1996 and the higher rate of increase was indicated at the part of higher land suitability for agricultural purpose estimated by IRS data.
Introduction
Agricultural land use system in the semi-arid tropics been developed to meet the demands of food supply for increasing population. The cropped area has been expanded over the land where the physical conditions of cultivation might be suitable. However in this area the land is prone to degrade its productivity and the distribution of cropped area may change temporally. In order to investigate the temporal change of agricultural land use satellite remote sensing data would be the most effective data source. Because the accuracy of published statistic information about agricultural land use is often skeptical and the land unit of statistics would not satisfy to examine the behavior of local land use changes.
Satellite remote sensing can observe the same area repeatedly with a certain intervals. From this advantageous feature a number of study have been performed on monitoring land cover or land use using remote sensing data. The study using low spatial resolution data such as NOAA AVHRR would be effective to monitor the seasonal change of land cover by its high frequency of observation in case of representing widely homogeneous land cover features. On the other hand high spatial resolution data such as LANDSAT TM and SPOT HRV would not be applicable to the study on detailed temporal change of agricultural land use.
International Crops Research Institute for the Semi-Arid Tropics (ICRISAT) in India and JIRCAS started a collaborative research program on the evaluation of environmental changes using remote sensing techniques in 1994. This program includes the study of temporal and spatial characteristics of change of agricultural land use in the semi-arid tropics of India using Indian Remote Sensing Satellite (IRS) data, which is categorized into high spatial resolution data . This paper shows a method to compare the state of agricultural land use between different years based on inconsistent date of observation and a tendency of land use change in correlation with land suitability estimated from IRS data.
Objectives
There are three major objectives in this study. The first one is to characterize the seasonal change of normalized vegetation index (NDVI) calculated from IRS data for each land use category. The second is to estimate the distribution of agricultural land use for the specific cropping season by applying a model to represent changing tendency of NDVI. And the last one is to examine the relationship between the rate of change of agricultural land use and the estimated land suitability.
Study Area
This study area includes the campus of ICRISAT located at the western side of Hyderabad city in the middle of Deccan plateau, where the amount of mean annual rainfall is about 800 mm. This area is characterized by the double cropping season in a year, which are Kharif (rainy) and Rabi (post rainy). Soil types dominantly appeared in the study area are Vertisols (black soil) and Alfisols (red soil) and both of them are representative soils of semi-arid tropics (Kanwar (1982).
Methods
In this study the area used for agricultural purpose would be estimated from NDVI values. For the case of Indian semi-arid tropics the quantative criteria of NDVI is considered as a better of discriminator of agricultural land use than usual supervised classification method. Because the cropping system in terms of combination of species is too complex and also sampling technique of training data in usual classification method differs individually.
The satellite data analyzed in this study is IRS LISS-II which consists of 4 spectral bands. The spatial resolution of IRS LISS-II is 36 meters and recurrent period is 22 days. Table 1 shows the list of acquired data, which is the entire sample of obtainable cloud-free data.
Table 1 List of Acquired IRS LISS-II Data
| Year (June-May) | Kharif | Rabi | Hot & Dry |
| 1988-1989 | none | 6 Feb | none |
| 1989-1990 | none | 24 Jan. | none |
| 1990-1991 | none | 2 Feb. | None |
| 1991-1992 | none | none | none |
| 1992-1993 | 21 Oct. | 26 Dec., 17 Jan | 24 Mar., 29 May |
| 1993-1994 | none | 13 Dec., 4 Jan. | 24 Apr. |
| 1994-1995 | none | 30 Nov., 4 Feb. | 11 Apr. |
| 1995-1996 | none | 22 Jan. | none |
In order to examine the temporal change of NDVI unchangeable land use in Rabi season through the analyzed period is determined by overlaying 3 times of classification data. The date of these data are 24 January 1990, 17 January 1993 and 22 January 1996, when the physiological phase of crops is represented between flowering and harvest.
Before calculation NDVI the minimum value in the histogram of each band data is subtracted to correct radiometrically biased amount. The same treatment is performed in the process of obtaining other indices calculated from IRS multi-spectral data in this study. These indices are redness index (RI) and brightness index (BI), of which the formula of calculation using band i (Bi) data is expressed as follows, respectively.
RI = (B3-B1)(B3+B1) BI = Öå(Bi)2
RI and BI are effective to discriminate black soil and red soil. It is also noted that these two indices could evaluate the land suitability for agricultural purpose as shown later in figure 5 (Uchida(1997)
Results and Discussions
1) Temporal change of NDVI
Land cover is classified into 5 categories, which are cropped area (C), forest or bush (F), degraded vegetation (D), bare land (B) and water (W), from 3 times of IRS data. Table 2 shows the constitution matrix of land cover changes between observed years.
| Table 2 Constitution Rate (%) of Land Cover from 1990 to 1993 (left) and 1993 to 1996 (right) | |||||||||||||||||||||||||||||||||||||||||||||||||||||||||||||||||||||||||
|
| ||||||||||||||||||||||||||||||||||||||||||||||||||||||||||||||||||||||||
Table 2 indicates that the almost half of the total area has changed its land cover types in a interval of three years. Cropped area also has changed its distribution widely and considerable acreage has been converted from forest or bush area to cropped area. This result suggests that agricultural land use has varied its distribution in these years and is necessary to monitor yearly characteristics of land use to recognize the agricultural activity in this area.
Here was assume that the land use type has been unchanged in the period from 1990 to 1996 if the land cover type is identical through three classified data. Figure 1 shows the relation between mean NDVI value of each land use type and days after October 1st for every IRS data. This future describes the following significant features. One is the value of NDVI lines from high amount in order as cropped, forest or bush, degraded vegetation and bare land for every samples. Another feature is a linear tendency of decrease of NDVI against passed days for each land use type in a period from November to February.
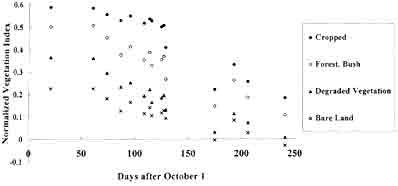
Figure 1 Temporal Change of Normalized Vegetation Index by Land use Type
2) Estimation of cropped area using NDVI
The relation shown in Figure 1 may lead a model to discriminate land use type using NDVI data. Figure 2 describes lines of boundary of land use types. These lines are obtained by a linear regression method for the middle points weighed by standard deviation for the samples of which the observation date is between November and February and year from 1990 to 1996. The correlation coefficients of each regression lines are -0.86, -0.92 and -0.90 from top to bottom, respectively.
This concept of land use discrimination is based on the presence of specific curve of observed vegetation index or leaf area index of cropped area (Huda et al.(1984), Fischer (1994). Figure 3 illustrates the case of this study an applicable period in the figure would coincide with late December to early February.
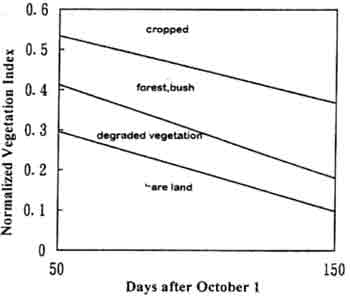
Figure 2 Land Use Discrimination by NDVI
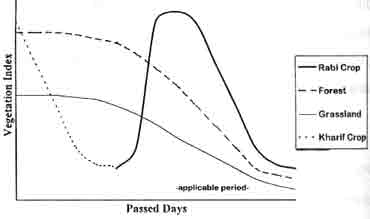
Figure 3 Representative Temporal Characteristics of Vegetation Index by Land Use Type
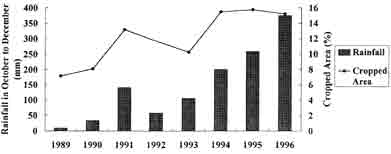
Figure 4 Estimated Cropped Area Using NDVI and Rainfall in October to December
Figure 4 shows the rate of estimated cropped area using the formation described in Figure 2. In this figure it is also represented the amount of rainfall in October to December, which may contribute the soil moisture content around the sowing stage. This figure indicates that cropped area tends to small in case of scarce rainfall around sowing stage. It is also noted that the cropped area has increased almost double in the analyzed period. Although there is no satisfactory statistics data to evaluate the reliability of estimation, these results could express the general tendency of land use change at the study area.
3) Relation between Land Use Change and Land Suitability
Uchida (1997) has examined the method to evaluate the land suitability for agricultural purpose using indices of soil color derived from IRS LISS-II data. Figure 5 illustrates the relation between land suitability and calculated indiced. In order to show the characteristics of change of cropped area by land suitability soil class unit is obtained by clustering of multi-spectral data of the least vegetation imagery (29 May 1993). Figure 6 represents the trend of change of cropped area by each soil class, where solid lines denotes the units or black soil and dashed lines on red soil.
The most suitable lass on black soil is numbered 8 and the next is 5. It is evident that the more suitable area has more percentage of cropped area. Another notable characteristics is the higher rate of increase at the more suitable area in the period from 1990 to 1994.
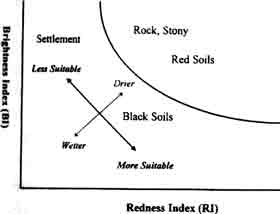
Figure 5 Relation between Land Suitability and Induced Derived from IRS Data
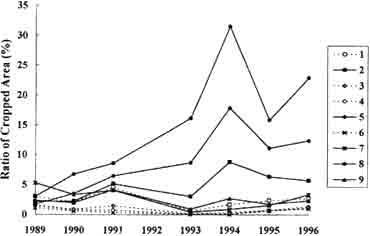
Figure 6 Temporal Change of Estimated Cropped Area by Soil Class.
Conclusions
This study has examined the applicability of NDVI of high spatial resolution satellite data for estimating cropped area in specific season of a year. In case of the semi-arid tropics of India the latter half of Rabi season would be available to employ a method of estimating cropped area using standard tendency of change of NDVI. The results of estimation show that the scarcity of rainfall around sowing stage would influence the extent of cropped area and the high rate of areal increase would be appeared at the place of higher suitability. Although it is required to evaluate the accuracy of estimation in detail, the method adopted in this study has a potential to accumulate the information on land use change which is indispensable in environmental problems.
The author is deeply grateful to Dr. F. T. Bantilan Jr. and Mr. Srinivas at GIS unit of ICRISAT for their cooperative performance. He should express thanks to Drs. Y. Yamamoto and H. Sasaki of National Grassland Research Institute for supporting projector activity.
References
- Fischer, A. (1994) : A Model for the Seasonal Variation of
Vegetation Indices in Coarse Resolution Data and Its Inversion to
Extract Crop Parameters, Remote Sens. Environ. 48,
220-230.
- Huda, A. K. S., et al. (1984): Problems and Prospects in
Modeling Pearl Millet Growth and Development, Agrometerology of
Sorighum and Millet in the Semi-Arid Tropics, ICRISAT,
297-306.
- Kanwar, J. S. (1982): Problems and Potentials of Vertisols
and Alfisols - The Two Important Soils of SAT-ICRISAT Experience,
Tropical Agriculture Research Series, 15, 119-138.
- Uchida, S. (1997): Analysis of Location Environment of Agriculture in the Semi-Arid Area of India Using IRS Data, Proc. Annual Conf. Jap. Soc. Photogram. Remote Sens., 301-306. (in Japanese)