| GISdevelopment.net ---> AARS ---> ACRS 1997 ---> Agriculture/Soil |
Multi Seasonal Analysis of
Optical Data for Agriculture in Mt. Pinatubo Area
Marcelina M. Dumayac*,
Genya Asito**, Nobuyuki Mino**, Shigeo Ogawa** and Ma. Arlene
M.Evangelista ***
*National Mapping and Resources Information Authority
fort Andres Bonifacio, 1201 Makati City, Philippines
**Natioonal Institute of Agro-Environmental Sciences
3-1-1 Kannondai Tukuba Japan
*** Bureau of Soil and water management,
Elliptical Rd. corner Visayas Avenue, Diliman, Quezon City, Philippines
Abstract *National Mapping and Resources Information Authority
fort Andres Bonifacio, 1201 Makati City, Philippines
**Natioonal Institute of Agro-Environmental Sciences
3-1-1 Kannondai Tukuba Japan
*** Bureau of Soil and water management,
Elliptical Rd. corner Visayas Avenue, Diliman, Quezon City, Philippines
In this paper, the authors developed a methodology t quantitatively estimate vegetation cover rations using multiple types of optical sensor data. these data were used to analyze the effects of the eruption form Mt. Pinatubo, the Philippines from 1991 ( eruption time ) to the present (1996). through satellite image analysis, changes in vegetation damage over time is assessed from the decrease in vegetation cover due to volcanic ash ands mudflows. A summary of finding and observations follows.
- Changes of vegetation Cover Ration (VCR) before and after volcanic eruption were monitored in the Mt. Pinatubo area using MOS-1/MESSR, LANDSAT/TM and JERS-1/OPS data. the map of VCR change helped clarify the dynamics of the affected are over time.
- With the aid of an algorithm incorporating hydrology in combination with VCR, area of secondary damages by mudflows of volcaminc ash and pyroclastic flow deposit were identified.
Satellite remote sensing is one of the most effective methods for monitoring vegetation changes. However, it is very difficult to acquire optical remote sensing data in Asian monsoon area due to their heavy cloud cover. Because of this, we cannot rely completely on one optical sensor to monitor vegetation with a suitable observation interval and over the long term. instead, we must use multiple optical sensors and/or Synthetic Aperture Radar (SAR) sensors. Mt. Pinatubo is located in the northern part of the Luzon Island and erupted on June 15, 1991. Agricultural and forested lands in this area suffered a lot damage. The authors performed satellite remote sensing monitoring of this are and estimated vegetation damages caused by ash fall and mudflows from Mt. Pinatubo using MOS-1/MESSR, LANDSAT/TM, JERS-1/OPS
Satellite data
We used MOS-1/MESSR data acquired before and after Mt.Pinatubo eruption, and LANDSAT/T, and JERS-1/OPSacquired after the eruption. table 1 shows the characteristics of the optical sensors used in this study and table 2 lists the specifications of the optical sensor data that have been utilized.
Instrument
Much of image processing and analyses were performed using ERDAS/IMAGINE software on a sun work station.
| Satellite Name/ sensor | Using period operation country | Resolution recurrent swath width | Band no. | Wave Length | Band name |
| LANDSAT | USA | 30M x 30m | TM1 | 450-520nm | Blue |
| /TM | 1984 | 17 days | TM2 | 520-600nm | Green |
| 185km | TM3 | 630-690nm | Red | ||
| TM4 | 760-900nm | Near infra-red | |||
| TM5 | 1550-1750nm | Middle infra-red | |||
| TM7 | 2080-2350 nm | Meddle infra-red | |||
| TM6 :120 m X 120m | TM6 | 10.4-12.5 nm | Thermal infra-red | ||
| MOSS-1 | Japan | 50 m X 50 m | MESSR1 | 510-600nm | Green |
| /MESSR | 1987-1995 | 16 days | MESSR2 | 610-690nm | Red |
| 100 km x 2 | MESSR3 | 720-800nm | Near infra red | ||
| MESSR4 | 800-1100nm | Near infra -red | |||
| JERS-1 | Japan | 18 m X 24 m | VNIR1 | 520-600nm | Green |
| /OPS | 1992 | 44 days | VNIR2 | 630-690nm | Red |
| 75 km | VNIR3 | 760-860nm | Near infra -red | ||
| SWIR4 | 1600-1710-nm | Meddle infra -red | |||
| SWIR5 | 2010-2120nm | Meddle infra -red | |||
| SWIR6 | 2130-2250nm | Meddle infra -red | |||
| SWIR7 | 2270-2400nm | Meddle infra -red | |||
| Satellite/sensors | Path row side.(sift ) | Acquisition data yyyy/mm/dd | Remarks | ||
| MOS-1/ | P29R98W | 1989/11/25 | Before eruption | ||
| /MESSR | P29R99W | 1989/12/29 | 2 scenes for making one mosaic image | ||
| ( | 1991/06/15 | Date of the biggest eruption | |||
| P29R99W(2) | 1991/07/05 | After 20 days ( special observation) | |||
| P29R99W(2) | 1991/10/23 | After 4 months ( special observation ) | |||
| P29R99W(2) | 1992/03/16 | After 9 months ( special observation ) | |||
| LANDSAT | P116R49 | 1993/04/02 | After 2.5 years | ||
| /TM | P116R50 | 1993/04/02 | 2 scenes for making one mosaic image | ||
| JERS-1 | P90R275 | 1995/07/14 | After 4 years | ||
| /OPS | P91R275 | 1996/01/07 | 2 scenes for making one mosaic image | ||
Monitoring
Georeferencing of the MOS-1/MESSR remote sensing data was performed using 1:50, 000 scale topographic maps. subset images of the whole cense were created of the study area in order to compare is conditions before and after the eruption. the study are is comprised of 1,460 columns and 1,460 lines (73 km by 73 m). the cell size is equal to that of MOS-1/MESSR sensor's spatial resolution (50 m by 50 m).
The use of vegetation index was thought to be the most appropriate method for evaluating the extent of the damage in the Pinatubo area. VCR was calculated using a vegetation index (KVI)20 given by the equations (1) and (2). The KVI is basically determined based on the difference between the spectral reflectance's of vegetation in Near Infra-red (NIR) wavelength and in Red (R0 wavelength as shown in formula(2).
KVI = NIR-a x R-b (2)
Here, a and b are constants, where a is obtained from the slope, and b is the Y-segment of the last square line fit through the data points that constitute the description of bare soil on there scatter plot of Red Band versus Near Infra-red Band (Known as "soil-line ") (fig 1)
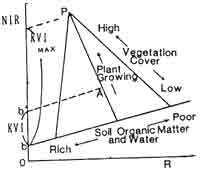
Figure 1. The concept of KVI and KVImax
An average VCR value of 4 pixels was assigned to one resample pixel in the output image. after this spatial aggregation. Each pixel size became 100 m by 100m.
The degree of damage can be obtained by the difference between before- and after-the eruption vegetation indices of a pixel. However, the percentage of damages appears to provide a more reasonable representation because we can easily understand damage processes. The parentage of damage (VCR (differ)) was calculated by formula (3).
| VCR (differ) = | VCR (
before)-VCR( after ) VCR ( before ) |
x 100 (3) |
Since the degree of damage is based on vegetation coverage information, areas with low or no vegetation cover before the eruption need to be handled separately. Such areas include clouds shadows, and smokes. supervised classification using maximum likelihood classifier was performed to the image data to extract area of water, cloud, cloud shadow, and smoke coverage. These then became the masking areas. The masking areas had no information about vegetation damage, so the degree of damage to these areas was estimated from surrounding data.
A histogram was used to demarcate the severity of damage into five percentage-based categories in order to facilitate human visual interpretation. this result was categorized according to the degree of damage to the vegetation into five classes; 100-90 % 90-60 % 60-30%, 30-10% and 10-0%.
The most severely damaged are (100-90%) occupied the majority of the study area three weeks after the eruption. four months after t eruption, the least damaged are (10-0%) had come to dominate with exception of areas along the rivers and near the to of the volcano. The areas remained in the highly damaged class (100-90 %). Table 3 shows the areas -estimation of the damaged areas. The to severely damaged areas (100-90%) covered as much as 164,000 has three weeks after the erupt in. the most severely damaged are decreased to about 22,000 has after four months, but areas suffering form 30% damage or above still remained more than 190,000 ha. The image data taken nine month after the eruption and two years after the eruption showed similar damage patterns as that of four months after the eruption. Image data taken four years after the eruption showed a title vegetation recovery.
Areas where vegetation was heavily damaged by mudflows were identified along the rives. based on Table 4 showing the area-estimation of the areas damaged by mudflows, these areas were expanding constantly as time went by.
| VCR (differ) = | VCR (
before)-VCR( after ) VCR ( before ) |
x 100 (3) |
In further analysis, the areas of clouds, shadows, smokes and low vegetation before eruption were determined. This was accomplished by selecting training samples of sea, land, clouds, cloud shadows, and smokes, and subsequent maximum likelihood classification of ht subsets to extract the areas of cloud, cloud shadow, and smoke coverage. The low vegetated area before eruption was extracted using KVI value. By these processes. The information necessary for masking was provided analysis area. The masking areas has no data about the vegetation damage. So these data was estimated form surrounding data.
A histogram was used to demarcate the sevently of damage into five percentage-based categories in order to facilitate human visual interpretation. this result was categorized according to degree of damage on the vegetation into five classes such as 100-90%, 90-60% 60-30%, 30-10%, and 10-0%.
The result of 3 weeks after eruption, 100-90% damage to the vegetation occupies the largest area. After 4 months, the least damaged vegetation area (0-10% damages) is dominated. Along the rivers and the areas and the areas near the top of the volcano remaining in the highly damaged (100-90% damaged ). Estimated damaged areas are listed on Table 3. the areas of most severely damaged (90-100% vegetation degraded ) had attained as much as 164,000 ha in the data of three weeks after the eruption. While the most severely damaged area was decreased to about 22,000 ha at the time of 4 month after the eruption, but more than 30% damaged area was will still existed more than 190,000 ha. The situation of 9 months and 2 years after eruption is almost same to the condition after 4 months. After 4 years, vegetation was recovered a tittle.
| Vegetation Cover decrease ratio % |
After 20
days 1991/07/05 1000ha (%) |
4
months 1991/10/23 1000ha(%) |
9 months 1992/03/16 1000ha (%) |
2
years 1993/04/02 1000ha(%) |
4
years 1995/07/14 1996/01/07 1000ha(%) |
| 100-90 | 164(33) | 22(4) | 41(8) | 57(11) | 32(6) |
| 90-60 | 123(25) | 59(12) | 35(7) | 48(10) | 34(7) |
| 60-30 | 86(17) | 101(19) | 91(18) | 93(19) | 67(14) |
| 30-10 | 38(8) | 93(19) | 104(21) | 80(16) | 113(24) |
| 10-0 | 88(17) | 218(44) | 228(46) | 221(44) | 232(49) |
Suffered areas of mudflows were extracts as high damage area along the rivers systems, and this results listed at table 4. the suffered areas increased constantly.
| After 4 months 1991/10/23 | 9 months 1992/03/16 | 2 years 1993/04/02 | 4 years
1995/07/14 1996/01/07 | |
| Damage area of mudflows 1000ha | 5 | 17 | 32 | 35 |
Acknowledgement
This study was performed by a collection program consisting of the Bureau of soils and water Management Department of Agriculture, National Mapping and Resources Information Authority in the Philippines and the national Institute of Agro-Environmental Sciences in Japan, under grains of the Special Coordination Funds Science and Technology Agency of Japan. We would like to express our acknowledgment to the members of these agencies.
Reference:
- Newhall, C.G. and R.S. Punongbayan (1996): Fire and Mud., Eruption and Lahars of Mount Pinatubo, Philippines, pp, 1126, University of Washington Press, Seattle and London.
- Saito, G., Y. Yasuda and Y. Emori (1991): Estimating sugar beet yields by spectral radiometer. Asian-Pacific Remote Sens, J., 4(1) 107-116