| GISdevelopment.net ---> AARS ---> ACRS 1997 ---> Agriculture/Soil |
SAR Backscater Response of
Various Growth Stages of Wetland Rice Paddy in Malaysia
Saiful Bahari B. Abu Bakar
and Abdul Talib B. Shaari
Malaysian Center for Remote sensing
CB 100, 5th Floor
City Square Center
Jalan Tun Razak Malaysia
Tel:+603-2645640 Fax: +603-2645650
H.T.Chuah and H.T.Ewe
faculty of Engineering
Telekom University
Bukit Bruang, Jalan Keroh Lama
Melaka Malaysia
Tel: +606-2523420 Fax:+606-2318696
Abstract Malaysian Center for Remote sensing
CB 100, 5th Floor
City Square Center
Jalan Tun Razak Malaysia
Tel:+603-2645640 Fax: +603-2645650
H.T.Chuah and H.T.Ewe
faculty of Engineering
Telekom University
Bukit Bruang, Jalan Keroh Lama
Melaka Malaysia
Tel: +606-2523420 Fax:+606-2318696
This paper investigates the capability of space-borne multi-data SAR images ( ERS-1/2) for monitoring of growth stages of wetland rice paddy crop. Four study sites were selected in the Kedah State, located in the northern part of Peninsular Malaysia, which produces 39% of total rice paddy output in ht country. The period of study was form April to September 1996, which cover the first cropping in the year. Ground data collection on soil and rice paddy plants were conducted around the days of the SAR data acquisition. in general, the phonological growth of wetland rice paddy could be classified into five main stages: land preparation, seeding, vegetative, ripening and harvesting. Preliminary results indicated that space-borne radar imagery has a great potential for delineation and monitoring different growth stages of wetland rice paddy.
Introduction
Rice is the staple food in Malaysia. The growing areas for rice paddy ( Oryaza sative ) form about 12.7% of total agricultural areas in country. Double cropping is practiced in Malaysia, where the first cropping is planted in April and harvested in September, while te second cropping covers the period form October to February in the foloowing year. The identification and real-time monitoring of rice paddy areas is therefore essential for econmonic reasons. traditionally, this has been done by using optical remote sensing data such as Landsat TM and SPOT data. However, due to cloud cover over the country, year-round optical data are ot possible. the ue of microwave remote sensing technology is a logical choice. Some work has recently been reported in the use of ERS-1 data for rice monitoring in temperate regions [1]. This paper reports on a similar investigation of the capability of using SAR images to monitor the phonological growth characteristics of wetland rice paddy in the tropical region. The study site is in kedah (MADA) * which accounts for about 97,200 hectares out of 144,900 hectares for the whole kedah State [2]. The images use are multi-date images from ERS ½. Ground measurements were conducted during the day of data acquisition. These include soil moisture content, soil composition, water depth, plant height, plant density, sizes and moisture contents of leaves, stems and stalks. the study covers the period from April to September 1996.
Fieldwork
Four rice paddy field in the Kedah State have been selected for the study: Kampung Tanah Seratus ( Lat. 601'50. 5"N, Long. 100021' 53.1" E), Kampung Rambai(Lat.602' 6.7"N, Long 100027'8"E), Kampung Hutan Kandis ( Lat. 6011'1.4", Long. 1000 24'33.1"E) and Kampung Telok Jawa ( Lat. 6013'24.9"N, Long. 100019'36.9"E). Six fields trips were conducted during the period of study from April to September 1996 (i.e. on April 27, May 19, June25, August 11, and September 15, 1996). During each field trip, the following ground truth measurements were made at the sites, the positions of which were checked by a GPS system
- composition and moisture contents of soil
- average height of paddy crops above the water.
- Moisture content and sizes of paddy rice plant constituents such as leaves and tillers
- Weather conditions.
| Date | Apr27 | May. 19 | June.1 | June.25 | Aug. 11 | Sep. 15 |
| Average height above water(cm) | 17.2 | 59 | 59.0 | 76.8 | 89.7 | 0 |
| Average leaf width (cm) | 0.42 | 0.88 | 0.9 | 1.1 | 1.13 | 0 |
| Average leaf thickness (mm) | 0.11 | 0.14 | 0.14 | 0.17 | 0.22 | 0 |
| Average stalk diameter (cm) | 0.4 | 0.4 | 0.5 | 0.6 | 0.6 | 0 |
| Average of moisture content of plant (%) | 76.2 | - | 79.8 | 75.2 | 53.2 | 0 |
| Average No. of tillers in a 0.5m x 0.5m plot | 176 | 186 | 186 | 132 | 90 | 0 |
| Average No. of leaves per tiller | 4 | 8 | 8 | 5 | 4.5 | 0 |
Result and Discussion
Figure 1 illustrates graphically the preliminary results of the study for site 1: kampung Tanah Seratus. figure 1(a) gives the average radar backscatter coefficient s° is obtained using the following equation:
where DN is the SAR image digital number, K= 63.43dB ( before 16.8.96) and K= 59.68 dB ( after 16.8.96) for ERS-1 data; while K=60.92 dB ( before 16.8.96) and K= 59.75 dB ( after 16.8.96) for ERS-2 data.
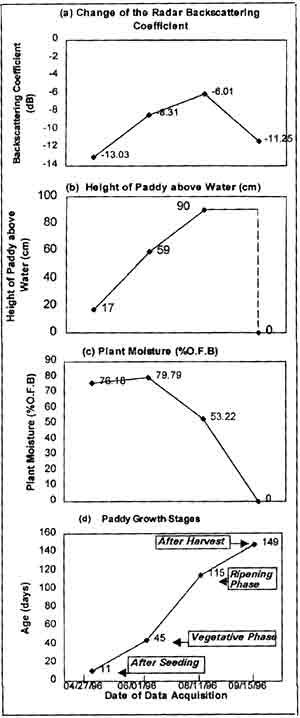
Fig 1: (a) Radar backscatter from ERS 1/2 Data (b) Average height of paddy crop above water level (c) Plant moisture(%O.F.B.) (d) Phenological growth stages of paddy plant.
All the images have been co-registered using SPOT Panchromatic data as reference. Note that s° form ERS ½ are VV-polarization.
Figures 1(b) and (c) shows the average height and moisture contents of the rice paddy crop, respectively ; whereas fig1(d) gives the growth stages of paddy during the study period. the following observations can be made:
- on 27th April 1996, the paddy was at its germination stage. The field was flooded with water s° was low since there was very little backscatter contribution from the water surface, and the plants were very small.
- On 1th June 1996, after 45 days, the crop was in the vegetative phase. The moisture content of the plant was high and the average height of plant above the water level was about 59cm. In this case, s° was higher since there was more returns due to volume scattering with the plant constituents.
- During the field trip on 11th October 1999, the corp. was in the mature /ripening stage. The plant moisture content was lower than on ht previous trip, but the average height was taller, s° was still high, indicating that plant moisture and plant height were two important factors that control the radar backscatter returns.
- On 15th September 1996, the paddy crops have been harvested, leaving, bare soil that was ploughed and prepared for the second cropping in the year. The field was also covered with water. Again we note that s° was relatively low compared to those at vegetative stage, or the ripening stage.
From this study, the backscatter coefficient s° of the rice paddy form ERS ½ does vary at different growth stage. the variation reflects the conditions /states of the plants and soil surfaces due to moisture content and plant height. Thus there is agreat potential for application of SAR images in delineation and monitoring of rice paddy. However, much detailed works need to be done to compare and contrast, qualitatively and quantitatively, for s° and the physical conditions of the fields, through goundtruth measurements and simulations. This will enhance one's confidence in the use of space-borne data.
Reference:
- Le Toan, T.,.F. Wang, Floury, N., K.H. Ding, J.A.Komg, M. Fujita and T. Kurosu, (1997), " Rice Crop Monitoring using ERS0-1 Data bsed on Experiment and Modeling Results,", IEEE Trans, Geoscience & Remote Sensing, Vol.35, No. 1,pp.41-56.
- Ewe, H.T. Chuah, A.Ismail, K.F.Loh, and N.Nasruddin, (1995), " Paddy Crop Monitoring using Microwave Remote Sensing Technique,", Geocarto International, Vol. 10, No.3, pp, 33-41
- Rashid, Abdullah, Padi ( paddy ), penerbit Prisma, Petaling Jaya, Malaysia, 1991.
The authors would be like to thank the Director General of Agricultural Department Peninsular Malaysia for providing the lab analysis and fieldwork, the Malaysian Center for Remote sensing for its financial support.