| GISdevelopment.net ---> AARS ---> ACRS 1996 ---> Oceanography / Meteorology |
Mid-day Atmospheric Humidity
from Thermal Infrared Observation of the NOAA-14 AVHRR Satellite:
Validation in Tropical Environment
T. Sarvanaapavan*, D.G.
Dye**, and R. Shibasaki*
*Global Engineering Laboratory
Department of Civil Engineering
Institute of Industrial Science
University of Tokyo, Japan
**Center of Remote Sensing
Department of Geography
Boston University
Massachusetts 02215, USA
Abstract*Global Engineering Laboratory
Department of Civil Engineering
Institute of Industrial Science
University of Tokyo, Japan
**Center of Remote Sensing
Department of Geography
Boston University
Massachusetts 02215, USA
Recent research introduced a method of estimating mid-day atmospheric humidity based on the "split-window" technique that takes advantages of the attenuation in thermal anfra-red (TIR) measurements by atmospheric water vapor. The method has been yet been evaluated in low-latitude tropical environments which have energy, temperature and precipitation regimes that differ substantially from than those of temperature latitudes.
We examine the effectiveness of the method to estimate mid-day atmospheric humidity through an application at selected sample sites in the seasonally moist tropical environment of Thailand. We employ daily 1.1 km resolution observations of the NOAA-14 AVHRR satellite in this study. Our analysis shows substantial promise for applying in this tropical environment. We also demonstrated application of the method for generating spatial maps on atmospheric humidity.
Introduction
Satellite remote sensing involves interpretation of emitted radiation, received and measured by an earth observing sensor. The emission from the surface is determined by the atmosphere, presence of water vapor, CO2 and O3 can be neglected when compared with water vapor as they have lesser optical depth in the TIR spectral region than water vapor (Price 1983). This atmospheric attenuation's considered as a to indicate the water presence in the atmosphere (Goward et al, 1994).
The dual TIR spectral sensors on the advanced Very High Resolution Radiometer (AVHRR) (channel 4, 10.3-11.3 mm) initially were designed to evaluate atmospheric water vapor attenuation in the 10-12 mm spectral region, with the objective of producing accurate ocean surface ocean surface temperature (Prabhakar et al., 1974, McClain et al., 1985), Goward. et al. (1994) introduced a method, based on the TIR attenuation by atmospheric water, to estimate mid-day atmospheric humidity and found reasonable success in validation in the temperate environment of Oregon, USA. The method, however, has not yet been evaluated in low-latitude tropical environments which have energy, temperature latitudes. Validation of the existing techniques in contrasting climates and contrasting landscape patterns is important prior to regional, continental and global application. In this study we focus on examine the method of estimating atmospheric humidity by comparing satellite estimation with ground observations at selected sample sites in the tropical environment of Thailand.
Background
In the estimation of the atmospheric humidity, the attenuation of the TIR measurements by water vapor is used as an indicator of the amount of the water vapor in the atmospheric. Wome researchers (Dalu 1986, Jedlovec 1990) identified the correlation between TIR split window measurements and precipitalble water in the entire column of the atmosphere between the sensor and surface (approximately 800 km depth with an area of 1 km x 1 km cross section, at nadir). The split window measurement and its relation with the water vapor in the lower portion of the mid-day atmospheric, surrounding the surface meteorological stations and the vegetation canopy have been discussed by Goward et al. (1994).
It is generally not feasible to estimate atmospheric humidity because atmospheric conditions can vary between inversion conditions, thermally stable conditions, and lase conditions, thermally unstable conditions (Resenberg et al., 1983). However, water vapor is furnished to the air only from evaporation surface of land and water. Water vapor transport into and through the layer of air adjacent to the ground is analogous to heat transport. Heat and water vapor are transferred to the bulk air primarily by convection or turbulent transport. During the mid-day atmospheric conditions, when surface heating produces strong vertical mixing in the active boundary layer, the perceptible water in the near surface atmosphere becomes well mixed within the active boundary layer. The satellite over pass time, approximately 1:30 p.m., is typically coincident with lapse conditions, when the atmosphere potential for estimating atmospheric humidity at the time of satellite over passing. Goward et al. (1994) introduced an approach by which the correlation between the calculated least-squares slope relation between the AVHRR TIR radiometric temperature (T4 and T5 from an observation of 9x9 array, centered on each of the study sites) and absolute humidity could be found. This approach included three main assumptions. First, the atmospheric was always experiencing strong vertical mixing. Second, atmospheric humidity during the observations was relatively uniform, horizontally, over the 81 km2 region of the observation. Third, as in the surface temperature calculations, emissivity did not vary with locations within or between sites.
Data and methodology
Five multispectral image data sets of the NOAA-14 AVHRR daily observations were acquired from Japan's National Institute of Environmental studies (NIES), and the United States' national Climate Data Center (NCDC) . The data sets were selected to represent connective days in different seasons (e.g. hot and dry season, rainy season and cool and dry season of Thailand (Moncharoen et al, 1987). The AVHRR data acquired for this study were in level b format, which is raw data that have been quality controlled, assembled into discrete data sets, and to which Earth location and calibration information have been appended, but not applied (Kidwell, 1995). The pre-processing we carried out includes mapping, radiometric calibration and cloud screening.
Ground measured methodological observations were acquired for validating the satellite estimation. The source of ground observed data used in this study was the Meteorological Department of Thailand. The data set includes daily humidity and temperature measurement in three hours interval of 71 stations in Thailand. The climate sample sites (Table.1) were selected by considering the representation of different landscape and climate patterns of Thailand and the availability of cloud-free satellite observations for the sites.
Table. 1. Selected sample sites and the information on geographic location.
| Site No. | Site Name. | Latitude. | Longitude. | Elevation (m) |
| 1 | Mae Hong Son | 19° 18' N | 097° 50' E | 269 |
| 2 | Chiang Rai | 19° 55' N | 099° 50' E | 395 |
| 3 | Chiang Mai | 18° 47' N | 098° 59' E | 314 |
| 4 | Nong Khai | 17° 52' N | 102° 43' E | 175 |
| 5 | Mae Sot | 16° 40' N | 098° 33' E | 197 |
| 6 | Mukdahan | 16° 32' N | 104° 43' E | 139 |
| 7 | Chaiyaphum | 15° 48' N | 102° 02' E | 183 |
| 8 | Ubon Ratchathani | 15° 15' N | 104° 52' E | 127 |
| 9 | Supan Buri | 14° 28' N | 100° 08' E | 8 |
| 10 | Korat | 14° 58' N | 102° 05' E | 188 |
| 11 | Surin | 14° 53' N | 103° 30' E | 147 |
| 12 | Bangkok | 13° 44' N | 100° 34' E | 20 |
| 13 | Rayong | 13° 38' N | 101° 21' E | 5 |
| 14 | Chanthaburi | 12° 36' N | 102° 07' E | 4 |
A slope relation between the plot of brightness temperature of channel 4 and 5 of a window array of observation (Fig. 1), centered on each sample site, was compared with the absolute humidity. As the remotely sensed observations record measurement from units of using the observations of relative humidity of find precise relationship with satellite observation. Absolute humidity is a measure of the atmosphere vapor in units of constant calculated from the relative humidity and air temperature measurement (Rosenberg, et al., 1983) observed at meteorological stations. The relationship between the slope of the channel 4 and 5 and absolute humidity were examined.
For estimating atmospheric humidity in temperate region, Goward et al. (1994) employed a window size of 9x9 centered on each sample site. The determination of the appropriate window size depends on the landscape pattern of observation as well as the condition of observation used in this study contain considerable number of cloud free observations are major consideration s for better relationship between TIR observations. Therefore estimations with 9x9 pixels (same as Goward et al., 1994), 24x24 pixels, and 36x6 pixels were compared with ground -observations for all clear sample sites.
Results and Discussion
The comparisons of slope relation of TIR brightens temperature of channels 4 and 5 (Fig.1) in different widow sizes of TIR observation with absolute humidity (Fig.2) calculated to identify the suitable window size of TIR observations in order to estimate the absolute humidity the tropical environment. Further, it reveals that the applications of window size of 9x9 may not be feasible in this study region as it does not have reasonable correlation with absolute humidity measurements (Fig.2). The poor correlation may be due small range of brightness temperature observations acquired for the determination of the slope of TIR observations.
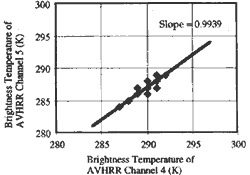
Figure 1. slopes of TIR observation, which is sensitive to the water vapor in the atmosphere, observed to the water vapor in the atmosphere, observed at Supan Buri on November 1, 1995.
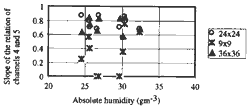
Figure 2. Comparison of the of the slope of the relation between the brightness temperatures of channels 4 and 5 in 9x9, 24,24 and 36x36 windows with absolute humidity.
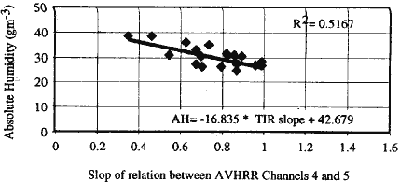
Figure 3. Comparison of the slope of the relation between brightness temperature of channels 4 and 5 and absolute humidity measured at the meteorological observed,
The slopes of the window sizes of 24x24 and 36x36 have appreciable negative correlation with absolute humidity, however, the increase in window sizes decreases the accuracy of representation of landscape centered on the sample window (1.1 km area). These results suggest that the window size of 24 x 24 is the most suitable one among the three windows considered in the analysis for estimating atmospheric humidity whether this size is university optimum and transferable to other seasons and regions requires additional study. The 24x24 window size was used in generating the spatial information on atmospheric humidity (Fig. 4) in this study region.
The slope of the channels 4 and 5 of TIR observations of all five dates in all clear sites were compared with measured absolute humidity of respective time and site (Fig. 3). The comparison shows a reasonably good correlation between absolute humidity and the slope of TIR observation. The spatial information on atmospheric humidity (Fig. 4) was generated based on the relationship between absolute humidity, derived from the observed relative humidity and air temperature, and the slope of the thermal infrared observations.
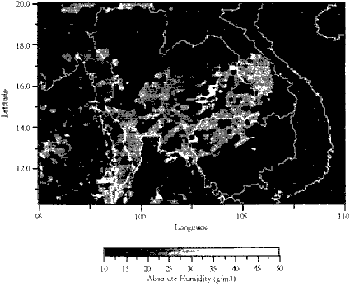
Figure 4. Absolute humidity generated from the slope relation of the thermal infrared channels (44x5) of the NOAA-14 AVHRR satellite on November 15, 1995.
Even though a strict cloud check scheme, based on Saunders (1988), was applied and optimal window size was adopted to pave the way to larger range of TIR observations, accuracy. The minimum range of TIR observation data within all of this analysis is 6°C, it is relatively a good range of observation a good rage of observation. However the precision of data set used in this study is 1.0°C The relatively low precision of the data may be a factor underlying the reduced accuracy. Goward et al., (1994) employed the TIR measurement, from a data set generated by Eros DATA Center, with a precision of 0.5°C but, with the 9x9 window size. They found that the 0.5oC precision is too small to estimate the slope with an observed minimum range of TIR measurement was 2.5°C. Both studies suggest that the precision of data set and the range of TIR observation play an important role in the accuracy in estimation of TIR slope.
Absolute humidity was calculated from observed relative humidity and air temperature measurement data collected at meteorological stations. The air temperature used in this study was observed at 1:00 p.m., close to the satellite overpass, the humidity measurement used was daily mean humidity. Relative humidity measurements near the overpass time were not available for this study region, So daily mean values were adopted.
Daily mean humidity. Relative humidity measurements near the overpass time were not available for this study region, so daily mean values were adopted.
This study suggests that higher accuracy in thermal infrared slope estimation may be attained with improvement in the precision of the thermal infrared measurements and the improved understanding of atmospheric humidity is feasible by applying the observations made at the time satellite overpass.
Acknowledgements
The authors would like to thank Dr. Y.Yasuoka of National Institute of Environemental Studies, japan for providing satellite data for this study, Dr. C. Tucker of NASA Goddard Sapce Flight Center, USA for providing GMS mapping software, and Dr. M. Takagi and Ms. C. Fujino of Murai-Shibasaki Laboratory, University of Tokyo, Japan for their numerous support during this study.
References
- Dalu, G. 1986. Satellite remote sensing of atmospheric water vapor. International Journal of Remote Sensing 7:1089-1097.
- Goward, S.N., R.H. Waring, D.G. Dye and J.Yang. 1994. Ecological remtote sensing at otter:satellite macroscale observations, Ecological Applications, 4(2), pp. 322-343.
- .Jedlovec, G.J. 1990. Precipitable water estimation from high-resolution split window radiance measurements. Journal of Applied Meteorology 29: 863-877.
- Kidwell, K.B. 1995, NOAA Polar Orbiter Data Users Guide. National Climate Data Center,Satellite Data Services Division, Federal Office Building #3, Washington, DC, USA.
- McClain, E.P. W.G. Pichel, and C.C. Walton. 1985. Comparative performance of AVHRR-based on multi-channel sea surface temperatures. Journal of Geophysical Research 90:11587-11601.
- Moncharoen, L.,T.Vearsip, and H.Eswaran. 1987. Benchmark Soils of Thailand, Department of Land Development, Thailand and Soil Management Support Services, USA.
- Prabhakara, C.,V.G. Dalu, and V.G. Kunde, 1974. Estimation of sea surface temperature from remote sensing in the 11-1 mm window range. Journal of Geophysical Research 79:5039 -5044.
- price, J.C. 198. Quantitative aspects of remote sensing in the thermal infrared. Pages 578-603 in G. Asrar, editor. Theory and applications of optical remote sensing. John Wiley & Sons, New York, USA.
- Price, J.C. 1983. Estimating surface temperatures from satellite thermal infrared data-a simple formulation for atmospheric effect. Remote Sensing of Environment 13:353-361.
- Rosenberg, NJ.,B.L. Bland , and S.B. Verma. 1983. Microclimate: the biological environment. Second edition. John Wiley & Sons, New York, USA.
- Saunders, R.W., and K.T. KRIEBEL. 1988. An improved method for detecting clear sky cloudy radiances from AVHRR data. International Journal of Remote Sensing 9:123-150.