| GISdevelopment.net ---> AARS ---> ACRS 1996 ---> Oceanography / Meteorology |
A Multiplayer-Multiresolution
Approach to Detection of Oil Slicks Using ERS SAR Image
L.Y. Change, K.S. Chen,
C.F. Chen and A.J. Chen
Center for Space and Remote Sensing Research
National Central University
Chung-Li, Taiwan
AbstractCenter for Space and Remote Sensing Research
National Central University
Chung-Li, Taiwan
It is well known that the increase of surface tension due to the presence of oil slicks causes the surface wave motion depressed or disappeared, thus making the surface electromagnetically smoother. There, the radar backscatted energy are significantly decreased. These damping effect is now well understood and it is such effects that enables the oil slicks to discernible from the radar image. In this paper, we shall concern with the digital technique that effectively delineates the oil slicks pattern from SAR image. The detected pattern allows us to estimate the coverage of oil spillage, for instance. Directly using SAR images to detect the oil slicks, however, is not sufficiently reliable because for complex process of SAR imaging mechanism and the existing of inherent multiplicative speckle noise. The technique we developed here is based on the combined multiyear and multiresolution basis and subsequently generating an image pyramid; (2) using multiresolution Laplace of image; (3) from coarse to fine, applying LoG ad DoG to all image pyramid, and (4) applying water area in August 5,1994 and September 5,1994 were used for testing. It was indicated that clearly enhances the oil slicks pattern. The robustness to the empirical parameters introduced in this scheme was also demonstrated.
Introduction
This study concerns with detecting of oil spill on ocean surface suing Synthetic Aperture Radar (SAR) image. Because the presence of oil slicks on sea surface increase the surface tension of sea water, he surface wave is significantly depressed or disappeared. This implies that the roughness of sea surface is lower if oil slick exists. It is now well understood that the radar backscattered energy is highly dependent on surface roughness [1,3]. Therefore, the gray value surface of such radar image will become a concave area if area is corresponding to an oil slick. In this work, we propose a scheme to detect concave area on the SAR images and infer that area is covered by oil slick.
Generally, SAR images are not generated by direct interactions with ground target. The information on SAR images comes from some secondary effect, for example, variation of surface roughness. The major problem is that the parameters that affect the roughness of sea water are too many, to name a few, wind field on sea surface, internal wave of sea water, etc. This problem becomes very severe when the area of interest large. Another drawback is that the SAR system uses coherent polarized wave as a detection source. As a result, the SAR image inherently contain "multiplicative speckle noise" and further complicates the detection of oil slicks.
Because of the reasons mentioned above, traditional image classification technique is clearly not suitable for this application, especially for some algorithms using pixel by pixel approach. In this study we propose a multiplayer and multiresolution scheme to overcome the forementioned difficulties. The scheme basically includes four major components; (1) reducing original image by a unit of 2 by 2 pixels and generating an image pyramid, (2) in the locate the position of oil slicks, (3) in the rest of the layers, using laplace of Gaussian to refine the oil slicks on edge portion in an order of coarse to fine, and (4) applying region growing [4] method as a final refinement. The flow chart of the scheme is shown in Figure 1.
Figure 1: The flow chart of proposed scheme for oil slicks detection.
2. Proposed Multilayer and Multiresolution Scheme
(1) Reducing original image and generating an image pyramid
Directly using SAR images to detect the oil slicks, to some extent, is not sufficiently reliable because of complex process of AR imaging mechanism and exiting of inherent multiplicative speckle noise. Therefore, we reduce the original image by a unit of 2 by 2 pixels and generate a multiplayer images and decrease the effect of noise and other sea clutter.
(2) .Using multiresolution Laplace of Gaussian and Difference of Gausian oil slicks detection in coarsest layer
It was mentioned that gray values of oil slick on the SAR images are lower than of background. That means that oil slicks on image gray value surface is a concave area and we can use a second order derivertive operator, Lapace of Gaussian (LoG)[3], to detect such area. A two dimensional LoG operator can be expresses as follows:
Figure 2 is the profile of equation 91) on x,y plane.
Figure 2 : The profile of equation (1) on x, z plane.
Equation (1) was repeatly applied over a W by W window on the image domain. In order to avoid deleterious truncation effects, the window size W should be such that W>=3C, where c = 2Ö2s is the width of the positive center lobe of the LoG function.
At this point, we can delineate the concave areas in image gray value surface by convoluting image with LoG operation and take the negative portion of resulting image. However, not all of such concave areas are oil slick coverage. In fact, oil film and sea water are electromagnetically different. The gradient of image gray value on the boundary of oil-water is greater than that made by other nature phenomena, for instance, the variation of wind field. Here we used a first order derivertive operator, difference of Gaussian (DoG)[3], to measure the sharpness of the edge on the boundary of the slicks just detected by last procedure. A two dimensional DoG operatior can be expressed as follows:
In this paper, the sharpnessof edge s defined as :
S(x,y) = [GoGx(x,y)* I(x,y)]2 +[DoGy(x,y)* I(x,y)]2 (3)
Where I(x,y) is image gray value on position (x,y) and "*" denotes covolution operator.
To justify whether the detected area is oil slick or not, a criterion should be empiricallychosen. In this paper, we select a thrshold as m+1.75s wher m and s are mean and standard deviation of sharpness over all image pixels, respectively. If the slick boundary pixels whose sharpnes is greater than the selected threshold, they are classified as an oil slick boundary. Finally, if the number of oil slick boundary pixels is greater than half of slick boundary pixels, we say this slick is qualified to be an oil slick. The flow chart of LoG plus DoG for oil slicks detection is shown in Figure 3.
Figure 3: The flow chart of LoG plus DoG for oil slicks detection.
Because the oil slicks vary in size, the window size of operator also has to be adjusted accordingly. In this paper, we apply lower resolution window (larger window size) to detect the oil slicks initially and then apply higher resolution window (smaller window size) to detect finer soil slicks based on the oil slicks detected by coaser resolution. This approach effectively reduces the sea clutter and preserves subtle variation of oil slicks.
(3) Coarse to fine multiplayer oil slicks refinement on edge portion
Once the oil slicks is detected in coarset layer, we can now use LoG to further delineate small variation of oil licks on edge portion in the rest of the layers. Note that the window size here use was empirically set to 19 by 19 pixels. The edge portions represent the buffered zone along the edge of oil slicks by a distance or 4 pixels.
(4) Using region growing as a final refinement
Generally, oil slick is not a completely concave surface on image. There may be some small convex surfaces and their curvature can be very small. Figure 4 illustrates this regard. The shadow areas will not be detected with LoG plus DoG procedure alone. We use region growing method[4] along detected oil slicks to find out all of oil slicks. A fullblown procedure is sketched in Figure 5.
Figure 4: Oil slick is not a completely concave surface on image.
Figure 5: the detailed flow chart of proposed scheme.
3. Experimental Result
We selected two ERS-1 SAR images to test the proposed scheme. Image A and Image B were acquired on August 5, 1994, and September 5, 1994, respectively. The location of test sites is depicted in Figure 6.
Figure 6: The Location of test sites
Subscenes were cut from original full scenes for testing. The image sizes of subscenes from image. A image B are 3000 by 3000 pixels and 2048 by 2048 pixels, respectively. The two full scenes are shows in Figure 7 and the square areas are the test areas as shown in Figure 8.
Figure 7: Original full scenes. The squares are test areas. (@ESA 1994)
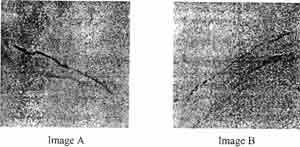
Figure 8 : Two test Images
In Figure 9, the red areas in both A & B are the detected oil slicks with proposed scheme and most of oil slicks was found by visual inspection
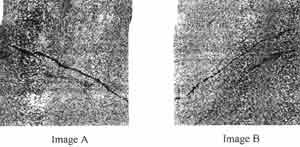
Figure 9. The red areas are the detected oil slicks with proposed scheme.
Figure 10 is part of enlarged oil slicks were the yellow lines delineate detected edge of oil slicks. It is worth to note that subtle variations of the oil slick edge was detected.
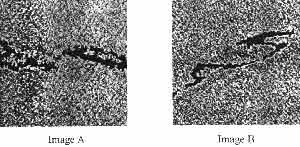
Figure 10: Part of enlarged oil slicks where the yellow lines delineate the edge of oil slicks.
4.Conclusion
There conclusive points can be made from this study:
- From the experimental results, the proposed scheme is able to effectively suppress the speckle noise and other sea clutter, and clearly enhances the oil slicks pattern.
- In spite f some of empirical parameters introduced in the proposed scheme, acceptable result were obtained when the same set of parameters are applied to different image. Thus, the applicability and robustness of the proposed scheme is demonstrated.
- Because the field test of oil slicks spillover on sea is extremely difficult, if not impossible, we have not sufficient ground truth as an evidence. Nevertheless, he effectiveness of the presented method was shown: Further validation may be required, if so necessary.
- Robinson I.S., Satellite Oceanography, John Willey&Sons, 1994.
- Ulaby Fawwaz T., Richard K. Moore and Adrian K. Fung, Microwave Remote Sensing, Active and Passive, Volume II, Addison-Wesley, 1982.
- Pratt Willian K., Digital Image Processing 2nd Edition, John Willey&Sons, 1991.
- Rosenfeld Azriel and Avinash C.Kak, Digital Picture Processing 2nd Edition, Academic Press, 1982.