|
Automatic
Detection of Oceanic Wave Length and Direction from SPOT Image
C.S.Wu,
C.F. Chen, K.S. Chen and A.J. Chen
Center
for Space and Remote Sensing Research
National Central University,
Chung-Li, TAIWAN, R.O.C.
http://www.gisdevelopment.net/aars/acrs/1996/ts7/ts7001pf.htm
Abstract
An
automatic method is developed to extract oceanic wave length and direction
of major wave pattern near the coastal water from SPOT image. The process
consists of three step: preprocessing, two-dimensional Fourier
transformation, and wave detection. At first step, the wave appearance in
the image is separated from the background in the image. Since the typical
surface waves in boundaries are always found in the image due to the
different water colors. The separation of wave patterns from the
background becomes very important in the and unrelated linear features in
the image, and then the probabilistic relaxation is image. At second step,
fourier transform is utilized to transform the binary image from the
spatial domain into the frequency domain for spectrum analysis. At the
final step, the wave spectrum image in the frequency domain is analyzed by
using filtering and clustering approach to detect the location of the
governing power in the image. Finally, the length and direction of
dominant ware is derived from frequency analysis. The method is tested by
using 1993/12/8 SPOT PLA image along the coast of Tai-Chung Harbor,
Western Taiwan. The wave lengths and directions vary from 70m to 66m and
from 86o to 103o, respectively, result demonstrates that the trend of
detected wave lengths and directions are consistent with the variation of
ocean current and shoreline topography.
1.
Introduction
It is apparent that the oceanic wave length and
direction are two important ocean parameters in the oceanography.
Conventionally, these data are collected by point-sampling from research
vessel or moored buoys. These are time-consuming, costly and sometimes are
dangerous. Satellite remote sensing presents a two-dimensional synoptic
view and has the ability to provide a large-scale and long-period
spatial-sampling data. However, the data volume being collected must be
many order of magnitude greater than those being collected by traditional
methods. Thus, an automatic detection system for remote sensing image will
be of great help to the oceanographer.
In this paper, we propose a
method which can automatically detect oceanic wave length and direction
form SPOT image (The system diagram is shown in Fig. 1). The proposed
method is divided into three stages : preprocessing, fourier
transformation and wave detection. Because the wave phenomena captured by
visible wavelength sensors, such as SPOT, is usually disturbed by the
change of water color, or is obscured by the solar reflectance of ocean
surface; the typical surface waves in the remotely sensed image normally
appear to be dim and blurry and, moreover, the linear boundaries are
always found in the image due to the different water colors. The
separation of wave patterns from the background becomes very important in
the first stop. This study uses the mathematical morphology to reduce the
noise and unrelated linear features in the image, and then the
probabilistic relaxation is employed to classify the wave patterns and
transform the image into a binary image. At second step, the fourier
transform is utilized to transform the binary step, the wave spectrum
image in the frequency domains analyzed by using filtering and clustering
approach to detect the location of the governing power in the image. As a
result, the wave length and direction of dominant wave is derived wave is
derived from frequency analysis.
Figure
1 The flow chart of the proposed system
In
the next section, we present the details of our algorithm. Section 3 and 4
give experimental results and conclusions, respectively.
2
Method
2-1 Top-hat transformation
Because the
remotely sensed image is the snapshot of ocean surface when the satellite
passes over the sea, the wave pattern in the image is disturbed by the
variations in scene illumination conditions, the change of water color and
other effects. To correctly compute wave length and direction, the wave
pattern must be separated from other phenomenon in the image. Top-hat
transformation [1] is used to extract wave pattern from background, the
original gray scale image f is first opened by a cylinder structuring
element B with a radius of 10 pixels. The resultant image is then
subtracted from the original, producing a different image Y which retains
wave information. The process can be expressed as follow.
Y = f - (f° B)
(1)
2.2
Probabilistic Relaxation
Since the wave information contained in
the difference image is, to some extent, obscure, it is difficult to
determine the wave length and direction from its spectrum. Thus, a
probabilistic relaxation scheme is used to classify the wave information
contained in the different image.
Probabilistic relaxation is an
iterative algorithm to reduce the ambiguity in local pixel assignment by
means of the contextual information. In probabilistic relaxation, must be
defined first. Several methods have been reported for defining the
compatibility coefficient process and parameter settings are based on the
scheme proposed by Danker et al [4]. Since the relaxation process can
converge to a good classification result at the early iteration of the
process [5], the process is controlled to iterate ten times for the reason
of efficiency.
2-2 Automatic thresholding
After the
probabilistic relaxation classification process, the histogram of wave
pattern image has been transformed to bimodal. It is easy to obtain a
binary image by using a thresholding method. The algorithm based on the
moment-preserving concept proposed by Tsai [6] was then applied to obtain
a binary image.
2-3 Extend Image
Obviously, If the
resolution in frequency domain is not high enough to discriminate the
change of wave length and direction, it is impossible to identify the
variation of these Parameters. To get higher resolution in frequency
domain, and to compute wave parameters more a accurately, the binary
wave-pattern image is placed is placed at the center of a 51.2 x 512 black
image (a image with gray value 0 only). This extended image is then used
as input of a two -dimensional fast fourier transformation algorithm. The
reason behind this is that the frequency domain resolution Df
and the spatial domain resolution Dx is
related by (2)
Where
N is the sample size per line.
2-4 Power spectrum rank
filtering
Generally, the main surface waves must have large support
in the frequency domain, while the support of noise in the frequency
domain is small. Consequently, to reduce the impact of image extension,
extension, a rank filter is designed to remove noise from the spectrum.
The principle of designed rank filtering the fit of a probe in a shape, it
is superior to the traditional morphological filter in the sense of noise
insensitively. The rank filter in this research is represented as follows.
where
Y(x) and X(x) represent the filtered and the original power of point x in
the spectrum, respectively. L = ||A||, A= x|X(x-u) > mean of X,
"u
ieB. B
is a disk mask and T is a threshold value.
2-5 Power spectrum
band -pass filtering
For most surface waves, the value of wave
length is always in the range of [0.05m, 500m] (excluding capillary
wave)]. This suggests that a band-pass filtering may be used to remove the
undesirable power in the frequency domain. Let x =
(nx,ny) denote a point in the spectrum (where
nx and ny represent x and y coordinate of x in the
spectrum, respectively.), the band-pass filter used here can be represent
as follows.
2-6
Cluster center of spectrum
The cluster center C = (Cnx,
Cny) of a N x N image spectrum
X = {X(xi),| xi
e
W1
£ i
£
N2}, W =
{(nx,ny) | 1 £
nx, ny £ N}
is obtained by weighting average method, with symmetric property
understood, as follows.
2-7
Wave length and direction
The wave length and direction of main
surface waves is computed by (7) and (8).
wave
direction = tan-1 Cnx/Cny
(8)
where
Dx =
6.25m for SPOT PLA image.
3. Experimental results
The
method was tested by using 1993/12/8 SPOT PLA image (Fig.2) along the
coast of Tai-Chung Harbor, Western Taiwan. The wave lengths and directions
computed vary from 70m to 66m and from 86o to 103o, respectively, when a
series of subimages cover from open sea to shore water was inspected. This
result demonstrates that the trend of detected wave lengths and direction
are consistent with the variation of ocean current and shoreline
topography.
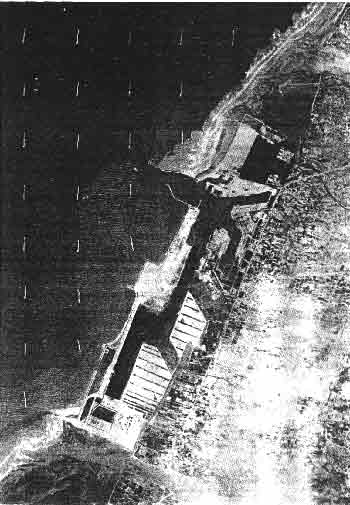
Figure
2 Algorithm derived wave field of SPOT PLA image (window size 256*256)
In
this paper, an automatic detection algorithm have been proposed to compute
the wave length and direction of ocean surface waves, the proposes
algorithm has the following advantages. First of all, the interference of
irrelevant ocean phenomenon has been suppressed by top-hat transformation
and probabilistic relaxation process. Secondly, the image extension
process enhances the frequency domain resolution, and the detection
accuracy has been increased. Finally, being taking account of real-world
wave behavior, the rank filter and the band-pass filter have been designed
to remove the noise in the frequency domain. Further research will be made
to extend the capability of the algorithm to detect multiple wave system
in the spectrum.
References
- J.
Serra, "Image Analysis and Mathematical Morphology." London, Academic
Press, 1982.
- S.W.
Zuker and J. Mohammed, "Analysis of probabilistic relaxation labeling
Processors", in Porc. 1978 IEEE cont. Patt Recong. Image. Proc.
- J.
Kittle and J. llingworth, "Relaxation labeling algorithms, - a review,"
Image Vision Comp. 3(4), 206-216, 1985.
- A.J.
Danker and A. Rosenfeld, "Blob detection by relaxation," IEEE Trans.
Patt.
Anal. Mach. Intell.
PAMI-3, 79-92, 1981.
- J.A.
Richards, D.A. Labdgerbe, and P.H. Swan, "On the accuracy of pixel
relaxation labeling," IEEE Trans. Syst.
Man Cybern. SMC-1,
pp. 303-319, 1981.
- W.H.
Tsai, "Moment-preserving thrsholing: A New Approach," Comput. Vision,
Graphics, Image Procesing, v29, pp. 377-393, 1985.
- P.
Maragors and R.W. Schafter, "Morphology filter -part 1: their set
theoretic analysis and relation to liner shift-invariant filters, "IEEE
Trans. Acoust. Spech Sig. Proc. ASSP-35,1170-1184, 1987.
- I.S.
Robinson, "Satellite oceangraphy: An Introduction for OceanGraphic and
Remote Sensing Scientists, "John Willey&Sons, 1994.
|