| GISdevelopment.net ---> AARS ---> ACRS 1996 ---> Mapping |
Speckle Reduction for Small
Feature Detection
Takako
Sakurai-Amano1 and Joji
Iisaka2
1Institute of Industrial Science, University of Tokyo
7-22-1 Roppongi, Minato-ku, Tokyo 106, Japan
Tel: +81-3-3402-6231ex2643 FAX: +81-3-33423-2834
E-mail: takako@tkl.iis.u.-tokyo.ac.jp
2Canada Centre for Remote Sensing
588 Booth St., Ottawa, Ontario, Canada K1A 0Y7
TEL: +1-613-947-1237 FAX: +1-613-947-1383
E-mail: Joji.Iisaka@geocan.emr.ca
Abstract1Institute of Industrial Science, University of Tokyo
7-22-1 Roppongi, Minato-ku, Tokyo 106, Japan
Tel: +81-3-3402-6231ex2643 FAX: +81-3-33423-2834
E-mail: takako@tkl.iis.u.-tokyo.ac.jp
2Canada Centre for Remote Sensing
588 Booth St., Ottawa, Ontario, Canada K1A 0Y7
TEL: +1-613-947-1237 FAX: +1-613-947-1383
E-mail: Joji.Iisaka@geocan.emr.ca
Many key feature that must be detected from SAR images are smaller or thinner than resolution size, especially in multi-look images. Most of previously developed de-speckling filters, in addition to speckle noise, also smooth out these small features because they were designed to extract large surface area like features. In other to extract small/thin features, the SFP (Small Feature Preserving) filter, developed to extract small and thin features, preserves such features fairly well while reducing speckle. Furthermor, a method to evaluate filters, using real images, was also developed during the course of this study. We compared the SFP filter with seven existent filters such as Lee filter, Frost filter, Sigma filter using a 3 look JERS-1image. We found that the SFP filter is the most appropriate filter to extract features brighter than the background, while the Sigma filter is the best one for features darker than the background.
1. Introduction
Many key features that must be detected from SAR images are small or thin. Several major difficulties arise when trying to detect those small/thin terrain features automatically from SAR imagery. The largest difficulty is that the back-scattering intensities of terrain objects are not unique. They are determined by such factors as the dielectric constant of terrain material. For example, a quiet water body usually appears s a very dark object in SAR imagery, Buty once the surface becomes rough, it no longer appears very dark. If disturbance is relatively small, it may appear relatively dark. But if the look angle is right and the surface is rough (a fall or a wind disturbed surface), it may appear even very bright. Thus we cannot distinguish different terrain objects only from back-scattering intensities. We have successfully integrated spatial and geometrical information as well as spectral information for the analysis of SAR imagery [1-4].
Second, the corresponding terrain features for those small/thin features are quite often smaller or thinner than the resolution size. For example, while width of an ordinary two lane road is less than 10m, the resolution of 3 look JERS-1 and 6 look ERS-1 images are about 18m and 30m, respectively. The corresponding resolution cell contains not only the road segment but also neighboring objects. It never appears as a continuous line with a constant intensity and width. It sometimes appears dissolved in the background or merged with neighboring objected.
There is also a problem of evaluating speckle filters. Evaluation of speckle are usually done using simulated images. These images comprise simple geometrical patterns of constant intensity, in which speckle noise is added using a simple multiplicative noise model. The evaluation on real image has been done only visually. But a real image is much more complex than simulated images as mentioned in the previous paragraphs. The good results obtained from simulated images are not often applicable to real images. There is a urgent need for a method to evaluate filters using real images.
This paper briefly describes the speckle reduction filter characteristics that is best suited to automatically detect small/thin features. This paper also describes the SFP (Small Feature preserving) filter developed during the course of this study. A method to evaluate filters are also briefly described. Eight filters including the SFP filter are evaluated and compared with each other.
2. Speckle Reduction for Small Feature Detection and the SFP Filter
Speckle is a phenomenon inherent in coherent imaging [13]. I theory, this "speckle" noise is multiplicative and proportional to pixel intensity. Many despecking filters have been developed, but the performance was not always satisfactory for the purposes of which the image was to be used.
The most important feature of speckle reduction filters for small/thin feature detection should be to reduce speckle yet to preserve small/thin features that are often of resolution size of smaller, Often, however, the only difference between relevant features and speckle is their spatial distribution. Unlike speckle, features of interest from ordered patterns, not random patterns. Since backscattering intensities are determined by many factors, intensity reconstruction is not the prime objective in filter development. Shape preservation is more important. Therefore main stream statistical filters may not work very well for this purpose. Spatially non-liner filters may be a solution.
Other features of a speckle reduction filters useful for the automated detection of small and thin features are :
Robustness Images usually comprise many different scenes, and the features of interest are not exclusive to one or another of the scene. For the purpose of automated detection of features, therefore, it is not desirable to use a filter that requires parameters too sensitive to scenes, especially when corresponding terrain features are smaller/thinner than resolution size. Since each resolution cell contains not only the features of interest but also those of surrounding are too sensitive, this will create yet another more difficult problem of determining the scene boundaries automatically.
Consistency It is also desirable to have a filter which shows the consistent performance for various situations. We prefer a stable filter to an unpredictable filter that sometimes performs superbly.
We developed a SFP (Small Feature preserving) filter to reduce speckle prior to he automated detection of small/thin features[15]. In stead of using popular statistical methods, the SFP Filter use a spatially non-linear filtering method similar to the Sigma filter[8] and a filter developed by Ali and Burge[12]] to preserve shape information. The estimate of the center pixel value of a moving window is given by
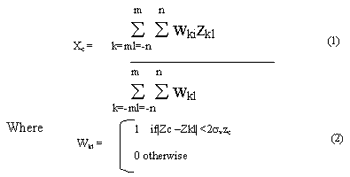
Here Zc,Zki and Zc are respectively the value of the center pixel, the value of the window pixel at k, 1, and the average pixel value of the window pixel, sv is the standard deviation of the multiplicative speckle noise. It can be estimated theoretically or measured from the image. 2m+1 and 2n+1 correspond to the window size. Unlike the Sigma filter and the filter developed by Ali and Burge, this filter does not have a mechanism of suppressing the right side expression of Equation (2). In this way, we can avoid lowering the average values of featureless areas in the Sigma filter Various small or thin features have been successfully from several spaceborne SAR imaging using this filer [16-18]
3. Evaluation Method and Experiment
Recently Lee et al. evaluated various speckle filter quantitatively using simulated images[14]. Evaluation of the filters applied to real images have been done only visually. They recommended small windows to extract small features. A smaller window, however, gives a good appearance but it is not necessarily good for automated detection of those features because small features from the noise. Current image processing techniques, however, cannot detect small features without reducing noise. Therefore the evaluation of filters should include not only noise reduction in the background but also the contrast preservation of the object of interest.
In a previous paper [19], we proposed a new evaluation method of despecking filter for the detection of slightly bright small features sing ship wake features in a 6-look ERS-1 image as an example. This method uses real images and evaluated the filters for the detectability of small/thin features by integrating both an ordinary speckle reduction measure and a new measure for the contrast of target features and their immediate background. As a measure of
Speckle reduction, we employed b defined by Lee et al. [14]. The key of the new contrast measure is the automatic creation of feature masks. Those feature masks are automatically created from a real image by binalzing at multiple threshold levels and the immediate background masks are also automatically created by dilating the feature area and the immediate background area. We summarized the results to demonstrate the abilities of several filters using the average ratios and average difference for eight randomly selected features among all measured features at three different threshold levels.
In this study, we applied a similar method to more filters and studied more features systematically. We used a 6000 pixel by 6400 line 3 look JERS-1 image of the Mt. Fuji area of Japan acquired on April 23, 1992. This image was processed by taking a square root of the sum of three independent look images. We evaluated eight filters for the detestability of both bright and dark small/tin features. Five small subimages (about 100x 100 pixels) of relatively featureless water areas were selected for the measurement of speckle reduction. For the contrast measurement, 19 bright features and 19 dark features were selected from three sub-scenes of different contrast in the image shown in Figure 1.
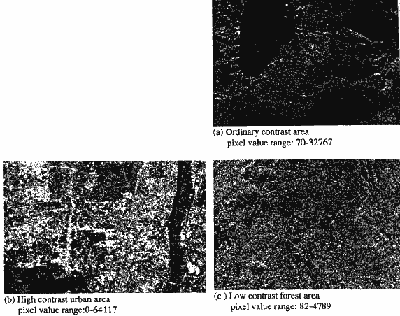
Figure 1. 19 bright features and 19 dark features were selected from three different sub-scenes for the evaluation of contrast. Image intensities were arbitratily stretched to provide a good appearance for each scene.
The Median filter, the Frost filter [7], the Lee filter [5,6], the Enhanced Lee filter [9], the Gamma MAP filter [10],the Sigma filer [8] and he Weighing filter [11] were compred with the SFP filter. We did not change some scene dependent parameter values scene by scene because there was no automatic way of defining scene boundaries in the entire image.
4. Results and Discussion
4.1. Speckle reduction in featureless regions
To find the ability to reduce the background speckle noise, we measured the degree of speckle reduction in 5 featureless areas using b values, the square root of the variance of the image divided by the mean, defined by Lee et al. [14]. The results could be classified into three groups as shown I Figure 2(a). The first group of filters reduced speckle very well, almost three fourths of the original images. The Median filter, the Frost filter, the Enhanced Lee filter and the Gamma MAP filter belonged to this group. The second group of filter were not as good as the first group but still fairly good and reduced speckle more than 1/2 . This group included the Lee filter, the Sigma filter and the SFP filter. The last group, the Weighting filter, reduced only slightly more than ¼ of original speckle noise.
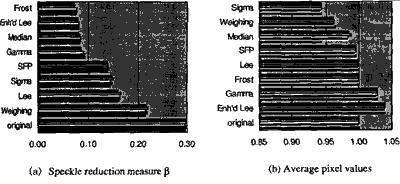
Figure 2 Speckle reduction in 5 featureless areas
Figure 2(b) shows the average pixel value for five relatively featureless areas. The values were normalized to the average values in the corresponding original pixel values. The average values of Frost filter, the Lee filter and the SFP filter were almost equal to the original average. The enhanced Lee and the Gamma MAP filter showed slightly higher values. The Median, the Weighting and the Sigma filter deviated to lower values.
4.2 Contrast and intensity of small features
The average target intensity It(i,j,f) and the average background intensity Ib (I,f,f) of a target feature at a certain threshold level were measured for 19 features high than the background and 19 features darker than the background in each filtered image. Here, i,j, and f indicates a feature, a threshold level and a filter, respectively. The following ratio Rf (i,j) can be defined as a measure of contrast.
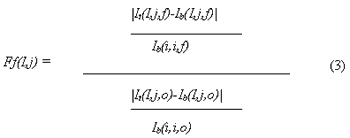
Were o indicate the original image. Although we measured the ratios at several threshold level for each features, we found that values of the ratio do not vary very much. Those values for each features can be determined within an error of approximately 0.05. Therefore we selected a middle level (not close to the background average value) threshold value between the average target intensity and the average background intensity to represent the ratio of each feature.
Brighter feature Figure 3 summarizes the results for the features brighter than the backgrounds. A thick line connects the ratio Rf at a certain level for each of 19 features. The vlues closer to 1 means that the original contrast of the target to the background was maintained. A thin line shows a variation of the intensity average of target features.
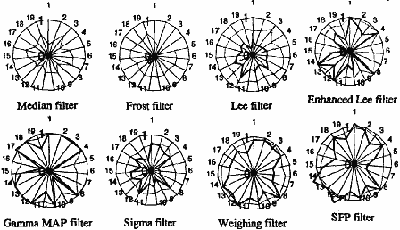
Figure 3 Preservation of the contrast and the intensity of the bright features.
There were four groups in this category. The Median filter and the Frost filter belonged to the first group. The contrast wavy very low, sometimes negative, indicating a poor ability of detecting small/thin features. The second group consisted of the Enhanced Lee filter and the Gamma MAP filter Those filter were excellent for some features, but very poor for other features. The third group consisted of the Lee filter and the Sigma filter. They performed only fairly for all features. The fourth group were the Weighting filter and the SFP filter. Those filters performed very well for all 19 features. The Weighing filter preserved not only high but also fairly constant contrasts for all features. The SFP filter surpassed the Weighting filter for the most features, but no for some features.
As for the target intensities as shown in thin lines in Figure 3, the Weighing filter and the SFP filter consistently preserved high although always slightly lower than original values. The Enhanced Lee filter and the Gamma MAP filter were not so consistent as the first group although they sometimes preserved the original values. The remaining four filters showed similarly low values. The Frost sometimes performed even worse.
Darker features Figure 4 summarizes the results for darker features. A thick line and a thin line respectively connect the ratio Rf and the average target intensity for each of 19 dark features.
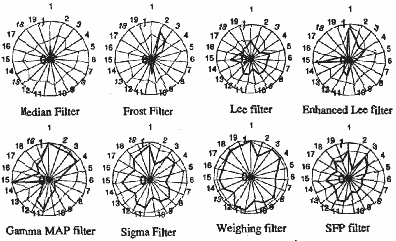
Figure 4 Preservation of the contrast and the target intensity of dark features.
The results were somewhat similar to those the brighter features except for the Sigma filter and the SFP filter. The Median filter and the Frost filter performed poorly and the Enhanced Lee filter and he Gamma MAP filter fluctuated very much. The Weighing filter still showed excellent results and the Lee filter showed only a fair result, filter did not perform well as in the bright features although it was still better than the Lee filter.
4.3 Final Analysis
We found two extreme cases in this experiments. The Weighting filter were excellent for both bright and dark features in the contrast experiment. However, as shown in Figure w, this filter could not reduce speckle noise enough for the current image processing technique to detect small/thin features from the filtered images. This filter was good only for visual interpretation. Other extreme cases were he Median filter and the frost filter. They reduced speckle very well as seen in Figure 2(a) but blurred the features of interest as well. These filters were basically good filters for large area-like feature detection but not appropriate filters for small/thin feature detection.
The Enhanced Lee filter and the Gamma MAP filter were different. They removed speckle in featureless areas very well. They sometimes preserved the contrast very well because they embedded the original pixels of the some very bright target areas to the well de-speckled images. The Gamma MAP filter embedded original pixels more frequently than the Enhanced Lee filter. Such a method, however, often showed many artifacts at the boundary of embedded original pixels more frequently than the Enhanced Lee filter. Such a method, however, often showed many artifacts at the boundary of embedded areas caused by the parameter mismatching. In theory, these artifacts can be removed by setting appropriate parameters of a scene or even for a feature. However, scene boundaries cannot be determined automatically. It is actually more difficult than detecting small/thin feature from a speckled image.
The Lee filter showed a fair but very stable performance for all features.
The Sigma filter consistently performed very well for the features darker than the background although this filter was not so good for the brighter features.
Unlike the Sigma filter, the SFP filter performed excellently for the brighter features. For the darker features, filter was behind the Sigma filter although still worked fairly well [16-18]. An additional phenomenon we should notice was that the SFP filter effectively removed the side band effect of antenna observed for very bright targets in SAR images and showed a very good contrast for very bright features. As long as the terrain feature, not the signal distribution, are our interest, this was a very desirable effect.
5. Summary and Conclusions
The SFP filter was developed for speckle reduction prier to automated detection of small/than features from SAR images. A new method to evaluate filters was applied to eight filters to determine the best filters for hat purpose. For the features brighter than the background, We fund that the SFP filter was the best filter prior to the automated small/thin feature detection. The Lee filter and the Sigma filter distant next. Other filters were not this purpose. For the features darker than the backgroud, the Sigma filter was the best closely followed by the SFP filter.
6. Acknowledgement
Authors wish to thank t Dr. M. Shimada and H. Oaku of NASDA, Japan for providing us with the JERS-1 image.
Reference
- Iisaka, J. and Sakurai-Amano, T., "Spatial assocaiation analysis for radar image interpretation", Proc. IGARS'93, Tokyo, Japan, pp 1224. 1227, 1993.
- Iisaka, J. and Sakurai-Amano, T., "Terrain feature detection from SAR data based on spatial association of objects", proc. Tenth Thematic Conference on Geologic Remote Seninsg, San Antonio, TX, pp.II441-454, 1994.
- Iisaka, J. and Sakurai-Amano, T., "Terrain feature recognition for SAR imagery employing spatial attributes of targets", Proc. ISPRS commission III Symposium, Munich, Germany, pp 399-408, 1994.
- isaka, J. and Sakurai-Amano, T., "Automated terrain feature detection from remotely sensed images", Computer Graphics and Image processing, Vol. 17, pp. 24-32, 1981.
- Lee, J.S., "Speckle analysis and smoothing of synthetic aperture radar images", Computer Graphics and Image Processing, Vol. 17, pp. 24-32, 1981.
- Lee, J.S., "Refined filtering of image noise using local statistics", Computer Vision, Graphics and Image Processing, Vol. 15 pp. 380-389, 1981.
- Frost, V.S. Stiltes, J.A. Shanmugan, K.S. and Holtzman, J.C,, "A model for radar images and its application to adaptive digital filtering of multiplicative noise", IEEE Transactions, Pattern Analysis and Machine Intelligence, Vol. PAMI-4(24), pp. 157-166, 1982.
- Lee, J.S. "Digital image noise smoothing nd the sigma filter", Computer Vision, Graphics and Image processing, Vol. 24 pp. 255-269, 1983.
- Lopes, A., Touzi, R. and Nesby, E., "Adaptive speckle filter and scene heterogeneity", IEEE Transactions on Geoscience and Remote Sensing, Vol. 28, pp. 992-1000, 1920.
- Lopes, A., Nezry, E., Touz, R. and Laur H., "Structure detection and statistical adaptive speckle filtering in SAR image", Int. J. Remote Sensing, Vol. 14, No. 9, 1735-1758, 1993.
- Martin, F.J. and Turner, R.W. "SAR speckle reduction by weighted filtering, Int, J. Remote Sening, Vol. 14. No.9, 1759-1774, 1993.
- Ali, S.M. and Burge, R.E. "New automatic techniques for smoothing and segmenting SAR images", Signal Processing, no. 14, pp. 335-346,1998.
- Goodman, J.W., "Some fundamental properties of speckle", J. Opt. Soc. Am. Vol. 66(11), pp. 1145-1150, 1976.
- Lee, J.S. Jurkevich, I. Dewaele, P., Wambacq. P., and Oosterlinck, A., "Speckel filtering of syntheic aperture radar images: A review ", Remote Sensing Reviews, Vol. 8, pp.313-340, 1994.
- Sakurai-Amano, T. And Iisaka, J. "Small feature preserving speckle reduction for high leve SAR image products", Major Projects Office Technical Report, No. 297-94, Canada centre for Remote Sensing, Ottawa, Ontario, Canada, 19 oages, 1994.