| GISdevelopment.net ---> AARS ---> ACRS 1996 ---> Land Use |
Ground Truth Survey for the
Development of Current Land use map, the western seaboard Regional
development Master plan study, Thailand
Sripen
Durongdej1, Pornthip Kanchansunthorn1,
K.Honda2, Shanker Pathak2, Nguyen Van
Dai2, Satya Priya2, Lal Samarakoon3, and
Seetharam K.E.3
1Deperatment of Geography, Kasetsart University
Phahon Yothin Road, Chatuchak, Bangkok 10900, Thailand
Tel:66-2-561-3480 ext 710 Fax: 66-2-472-6304
E-mail: fsocspd@nontri.ku.ac.th
2GIS Application Center (GAC),
Asian Institute Thani 12120,Tah
P.O. Box 4, Khlong Luagn, pathum Thani 12120, Thailand
Tel: 66-2-524-6149 Fax: 66-2-524-6147
E-mail: honda@ait.ac.th
3Nippon Koei (Japan)
2304 Takasaki Kukisaki Inashiki Ibaraji Japan
Tel : 81-298-71-2040, Fax: 81-298-71-2022
E-mail : a4380@n-koei.co.jp
Abstract
1Deperatment of Geography, Kasetsart University
Phahon Yothin Road, Chatuchak, Bangkok 10900, Thailand
Tel:66-2-561-3480 ext 710 Fax: 66-2-472-6304
E-mail: fsocspd@nontri.ku.ac.th
2GIS Application Center (GAC),
Asian Institute Thani 12120,Tah
P.O. Box 4, Khlong Luagn, pathum Thani 12120, Thailand
Tel: 66-2-524-6149 Fax: 66-2-524-6147
E-mail: honda@ait.ac.th
3Nippon Koei (Japan)
2304 Takasaki Kukisaki Inashiki Ibaraji Japan
Tel : 81-298-71-2040, Fax: 81-298-71-2022
E-mail : a4380@n-koei.co.jp
The western Seaboard Regional Development Master Plan Study is a joint project between the Japanese government and the Thai government. The project aims to develop a master plan study for the western seasboard region in Thailand and to develop a current land use maps using remotely sensed data. The Geographic Information System (GIS) database is also developed for mapping facility and for facilitating future development plan of the region.
To identify land use classes and land cover, a systematic ground truth survey is established by three involved agencies. An interpretation key sheet is developed to be used during the ground turthing process in order to provide key features for further visula image interpretation. During the ground truth survey, GPSs, topographic maps of the selected area, printed Landsat-TM sheets, and cameras are essential needed equipment. An interpretation key sheet consits of descriptions, of land cover; UTM coordinates and/or latitude and longitude values taken by the GPSs; details of the topo map sheet; a photograph of the selected location and comments. Interpretation on the Landsat image is roughly prepared in the field. Visul image interpretation is applied for the development of current land use maps based on ground truth key sheets and th topo maps. Key sheets can be used effectively for visual interpretation.
It is recommended that satellite images should have been geo-corrected before conducting the ground truth survey. It is recommended that a powerful notebook computer with a CD-Rom drive should be utilized during the field survey to facilities the ground truthing.
1. Introduction
the Western Seaboard Regional Development Master Plan Study is a joint project between the Japan International Cooperation Agency (JICA) which represents he Japanese government, and the National Economic and Social Development Board (NESDB) which represents the Thai government. This project aims to develop a plan study for the western seaboard region in Thailand. It also aims to develop a Geographic Information System (GIS) database for the development plan of the region. Physical data collected from various involved government agencies are required for such purpose.
The initial stage of the study is to identify land cover and land use classes of the whole region and to map them. Remote sensing data are used for updating current land use and land cover. For Classification of remoe sensing data, ground truth data are the essential information in elating the remotely sensed data to the real land cover characteristics. In so doing, the Department of Geography (GOC), kasetsart University, the GIS Application Center (GAC), and the Nippon Koei (Japan) have together established a systermatic ground truthing method, using Landsat0TM data, for the development of current land use map of the western seaboard region. In this project, DOG is assigned to conduct the ground truth survey of the region and to prepare key sheets which provide significant ground truth data for satellite image interpretation, Based on the provision of the ground truth data, GAC further interprets and analyses images of the whole area, and prepare current land use maps using GIS facilities. This paper presents the systematic methodology applied in conducting the ground truth survey, preparation of key sheet to be used later as guidance for satellite image interpretation, and brief description of how map is developed from the field survey results.
2. Purpose of the Ground Truth Survey
The main purpose of ground truthing is to collect basic information from realities for satellite image interpretation and landuse mapping. Our purposes can be described as follows.
- To identify land use or land cover of the real location and then compare it to what is shown on the image.
- On the image, identify colours, tone shape, texture, location and size. Such information provides basic guidance for further image interpretation of similar land use category in other areas. The basic guidance is in the from of key sheets.
- To verify and update existing data especially data on the map sheets or topographic maps. Also to verify the pre-interpreted image data that have been done prior to ground truthing.
- To collect more related data from local people. Interviewing or asking local people for more details such as location, land use activities, settlement history, and timing will help understand land use and cover better. It also verify image interpretation of inaccessible areas.
3. Ground Truth Survey for the Western Seaboard Region.
According to the delineation of the western seaboard region , the ground truth survey covers some districts of Kanchanaburi province, and other five nearby provinces namely Samut Songkhram, Ratchaburi, Phetchaburi, Prachuap Khiri Khan and Chumporn. The survey was intensively conducted during 6 April to 16 May, 1996, with total number of 568 survey points. Numbers of survey points in each province vary to its size. Larger size provinces have bigger numbers survey points. The total
568 survey points of the six provinces provide enough raw data for visual interpretation. The distances of the survey points, as in many cases, range from 2 to 4 km.
Total area of the western seaborard region is 2,762,831 hectares or 27,628 km2 containing 41 districts in six provinces. The shape of the western seaboard is long and narrow with the approximate length of 600 km. In distance.
Equipment utilized in the field
- Two GPSs (Global Positioning System) : one Sony, and one Magellan. These are used for defining UTM coordinates and latitude and longitude values of each survey point.
- Two sets of 1:50,000 topographic map sheets-one original and one photocopied. Each topo map provides real UTM coordinates and latitude and longitude values, location of each survey point, and land cover information.
- Landsat-TM images at the scale of 1:100,000 taken during March-May, 1995. The Landsat-TM raw data have been enhanced by standard false color combination of R:G:B using combination of band 4:3:2 respectively. Data of the entire area were printed on totally 120 A4.
- Cameras for taking colour picture of the real and land cover.
- One pair of binoculars to distinguish different entities of the distant area such as different types of forest.
Before conducting a ground truth survey, researchers need to investigate thoroughly details of the images of the study area in order to identify interesting points or areas where ground truthing is needed. All images will be covered transparencies to protect images. After identification, all selected points or polygons will be delineated for further interpretation and classification.
The next step is to locate the points selected by comparing the image and the topo-sheets. When location is found, researchers need to plan the survey route (s) according to the distance, the order of places, their accessibility and available timing. To travel to the point (s) previously selected, researchers need to consult the GPS and topo maps, and in many cases, the local people. Once the location is found, the GPSs will be used to establish the coordinates-latitude and longitude, and UTM- of each survey point and record them on the interpretation key sheet. To establish the ground truth data, color (s), tone, shape, size, and texture of that point in the image will be identified and recorded, and compared to the true land cover. Color photographs showing the real land cover of the location will be taken. Explanation for each land use/land cover category will be provided on the key sheet according to its ordering survey point numbers. The survey point numbers will also given on the topographic map sheet. These numbers will correspond to the survey points.
Appropriate symbols describing land cover categories will be marked on the transparency for areas having same land use class. Interviewing farmers/owners/workers of the survey area for more details is necessary especially in area where land use activities are not clear to researchers. This information includes month as the image, and other related activities. During field survey, many errors on the topo map are always found. The main reason is that most data on the topo maps are not updated, therefore, they have been corrected and updated by the field survey and the images.
Each interpretation key sheet consists of descriptions of land cover; location; path, row and date of the Lnadsat-TM; UTM coordinates and/or latitude and longitude values
Taken by the GPSs; the survey point number; details of the topo map sheet; data of the ground truth survey; a photograph of the selected location taken from the field showing the real land cover and a photograph of the topographic map sheet showing the selected point; and comments. An example of the interpretation key sheet is shown in Figure 1.
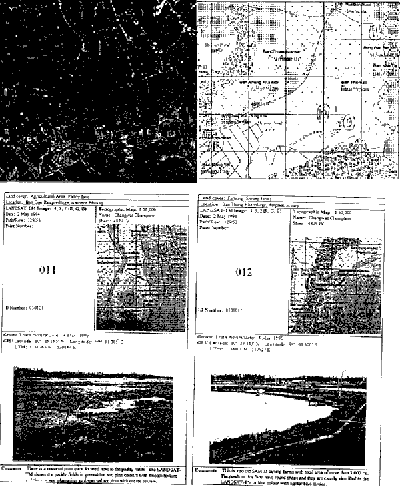
Figure 1 The Final Key for Survey Point Numbers 11 and 12.
To read the final key, one need to have a print of the Landsat-TM image of the selected area with the identification of the survey point numbers and identification of the land use classes that shown in the interpretation key sheet. For example, Figure 1 shows key sheets of the two survey points namely 011 and 012. These two points can be identified from the copied topo map sheet and the Landsat image sheet as number 11 and 12. From the comments, color photos of the area and the topo map sheet, and the Landsat image interpretation which firstly interpreted by the survey team, one can easily interpret the satellite images. Interpretation key sheets have later been prepared and combined the satellite images. Interpretation key sheet have later been prepared and combined into 6 volumes represented 6 provinces in the western seaboard region.
5. Development of Land Use Map
The visual interpretation was firstly simply interpreted by the DOG as resulted in the 6 volumes of the interpretation key.s. GAC has further interpreted the whole images of the area to develop a land use map. Digital image processing was firstly applied to Kanchanaburi province using ERDAS software. The results of the supervised classification in comparison to visual interpretation have low accuracy due to complexity ofland use classes. For example, bare soil and buildings cannot be separated from each others. More difficulties are to separate the upland crops from forest plantation, and to distinguish forest types. Even paddy fields may be irrigated and non-irrigated, and some part appears in the images as open space when it is harvested. In this case the digital image processing cannot separate the real open spaces from the dried harvested paddy fields due to the same value of spectral responses. Finally, visual interpretation is done in integrating with the GIS database and the field survey data which provide large raw for this purpose.
Other GIS data such as the existing land use map at the scale of 1:250,000 and the topo map sheets at the scale of 1:50,000 have been used during the visual interpretation of the interpretation of the entire area. When the interpretation step is over, all results are joined for the preparation of current land use map as shown in Figure 2.
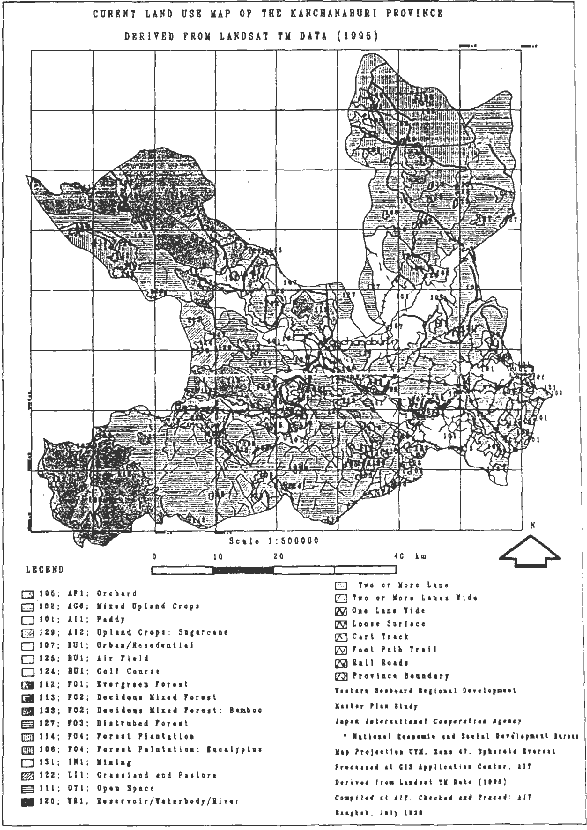
Figure 2 Current Land Use Map of Kanchanaburi Province Derived from Landsat-TM Data, 1995
6. Recommendations
Firstly, it is recommend that the satellite imageries should have been geo-corrected and overlaid by UTM and/or latitude and longitude values prior to conducting field survey. This will assure the survey team members in getting the right location of the real world and the exact spot on the image. Secondly, it is recommended that a powerful notebook computer with a CD-Rom drive can be utilized in the field survey computer while raw data from ground truthing can be directly can by directly input in it.