| GISdevelopment.net ---> AARS ---> ACRS 1996 ---> Land Use |
Integration of Remote Sensing
and GIS for Land Use/Land Cover Mapping in Nil Wala Basin
W.T.G. Mendis & A.
Wadigamangawa
Survey department, Sri Lanka
Abstract Survey department, Sri Lanka
Development of Remote Sensing and Geographic Information System (GIS) technologies have lead to the betterment of mapping and interpretation techniques as a means of understanding and effectively managing the present resources for sustainable. Analysis of mechanisms of land use pattern changes plays an important role in not only forecasting changes but also formulating local development policies.
The Nilwala Ganga Rehabilitation Project Program of Southern Province is being implemented by the Governmented by the Government. The Landuse/Landcover is one of the most important layes inany GIS for Agricultural Resources Management.
The main objective of this study is to find out changes of Land use/Land cover patterns due to implementation of the Nilwala Ganga Flood Protection Scheme.Both air borne and space borne remote sensing offer efficient and timely data for monitoring spatial changes of patterns over a period of time. A comparative study was also carried out in order to find the level of information obtainable from two remote sensing techniques. The result from this study showed that the Integration of Remote Sensing and GIS appears to have a potential for providing necessary information for updating Landuse maps.
1.0 Introduction
Remote Sensing is a powerful technique for Surveying, Mapping and Monitoring earth resources. This technology combined with GIS which excels in storage, manipulation and analysis for Geographic information and Socio-economics data provide a wider application. Land resource and environmental decision makers require quantitative information on the spatial distribution of land use types and their conditions as well as temporal changes. Remotely sensed satellite data in conjunction with available other data sources have been used to find such land uses.
The Nilwala basin project in the southern province was originated in 1986 to over come seasonal flooding However the presentation of floods had reduced fertility of the irritable land. As a result of this there have been changes in land use pattern. That means ecology as well as socio-economic balances of the region have been changed. Hence proper land use planing is a major requirement in order to prevent these situation.
2.0 Objectives
The major objective of this study was to find out changes of land use/land cover pattern due to implementation of the Nilwala Ganga Flood Protection Scheme (NGFPS). Then to analysis reasons for these changes and to propose a method for identifying major changes using satellite imagery in conjuction with exiting land use information in GIS.
3.0 Study Area
The study area covers Nilwala River Basin in the Southern Province of Sri Lanka. Catchment area of 971.0 km2. Fallingng within the latitude and longitude between 5o 55' & 6o 13' and 80o 25 80o 38'. ( as shown in Diagram 1.0)
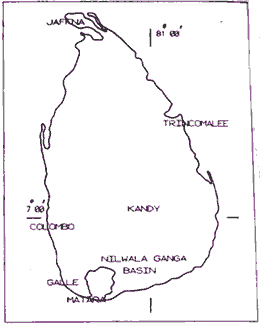
Diagram 1.0
4.0 Data used and Methodology
4.1 Data Used:
The data used are given in table 1.0
| Data | Date | Scale/Resolution |
| Landuse Map | 1981 | 1:100,000 |
| Topographic Map | 1983 | 1:50,000 |
| Landsat TM | March, 1992 | 30 m Resolution |
| Aerial Photographs | 1994 | 1:20,000 |
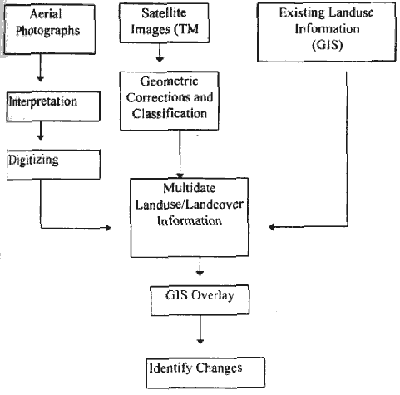
Figure 1.0 (Proposed Methodology)
4.2 Satellite Data:
PCI Software [1] that is an integrated image processing & Geographic Information System was used for digital analysis of analysis of Landsat Thematic Mapper ( TM) Data. The aim of the digital processing was to generate a classified image.
The atmospheric corrections performed prior to the image classification. Then the image was geo-referenced using 1:50,000 Topographic map of the study area. Considering the most useful combination of spectral bands for Landuse/landcover mapping, our first choice was only bands B3,B5 and B7. If NDVI (Normalised Difference Vegetation Index, i.e. B4-B3/B4-B3) is correlated with climatic variables that are known to influence plant growth [2]. Hence, there is a possibility to distinguish irrigated vegetation and natural vegetation. Keeping that in mind, NDVI was calculated for TM data since it is an effective indicator of the amount of green vegetation presented in an observed Landscape.
The selection of training areas were based on spectral signature and spectral seperatebility among classes. Training statistics of each class (variance -covariance matrix) were generated. Finally, a classified image was generated by supervised classification based on Maximum Likelihood classifier. The Landuse boundaries of the classified image were then convert to vector in order to compose 1992 data of land cover (Figure 2.0)
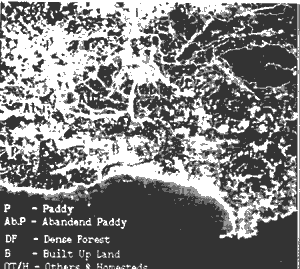
Figure 2.0
4.3 Other Data:
From available latest photography (1994) the Landuse/Landcover patterns were interpreted and compiled in to 1:50,000 scale (Figure 3.0). There data convert to digital form. The existing landuse layer (1:50,000 Topographic map & 1:100,000 Landuse map) in a GIS was also extracted in order to find out the temporal changes. Figure 4.0 shows the 1983 Landuse/Landcover infromation.
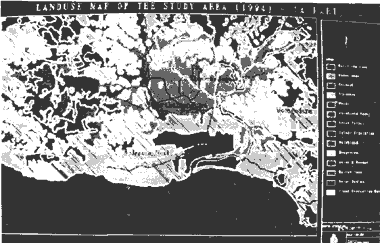
Figure 3.0
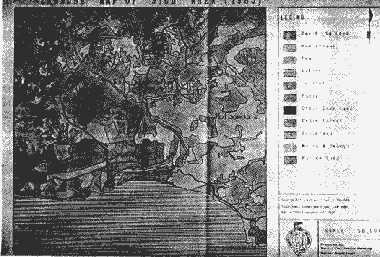
Figure 4.0
4.4 Generation of Multidate Landuse/Landcover Information
From GIS Landuse layer (1:50,000) and 1994 Landcover eight different categories were chosen to identify major changes. The multi level data layer concept [3] was not applicable for this study to produce multi data Lanuse/Landcover layer because of the scale difference of the available data. Hence 1:100,000 information was not used for comparison.
Only five categories were chosen in classified Lansat TM (1992) image for comparison. It was not possible to identify the other categories due to their high spectral correlation.
5.0 Results of the Multitemperal Comparison
In multitemperal assessment the 1993 Landuse data compared with 1992 TM image and 1994 Landuse/landcover. The results of the part of study area pertaining to Landcover changess are summarised in Table 2.0. The Landuse/Landcover classes and their changes are briefly discussed below.
- Built-up land, Forest, water categories are not shown the major change when compare with 1994 landcover information.
- Paddy, homestlead and coconut were very much affected.
- Marginal decrease of the paddy cultivation observed
- A new landuse category also identified in the study area and it was abandoned paddy Vast stretch of this Landcover presented along the Nilwala River basin (see figure 2.0).
- Previous paddy cultivation now improved as homesteads and other plantation (cinnamon)
| Landuse/Landcover Classes | 1983 Landcover | 1992 Landcover (LANSAT TM DATA) | 1994 Landcover | Percent difference of 1992 with 1983 | Percent Difference of 1994 with 1983 | |||
| Area(ha) | Percent of total study area | Area (ha) | Percentage of total Area | Area (ha) | Percentage of total study area | |||
| Water | 2561.9 | 25.62 | 2546.3 | 25.46 | 2573.8 | 25.74 | -0.16 | 0.12 |
| Built_up land | 487.25 | 4.87 | 484.2 | 492.81 | 492.81 | 4.93 | -0.03 | 0.06 |
| Homesteads | 2621.7 | 26.22 | 4603.5 | 3210.6 | 32.11 | 32.11 | 19.82 | 5.89 |
| Coconut | 731.71 | 7.32 | - | 195.97 | 1.96 | 1.96 | - | -5.36 |
| Paddy | 3057.9 | 30.58 | 848.2 | 1443.2 | 14.23 | 14.43 | -22.10 | -16.15 |
| Forest* | 143.16 | 1.43 | 137.8 | 114.37 | 1.14 | 1.14 | -0.05 | -0.29 |
| Ab.Paddy | Nil | - | 1166.9 | 1428.4 | 14.28 | 14.28 | 11.67 | 14.28 |
| Others | 395.74 | 3.96 | 213 | 540.12 | 5.40 | 5.40 | -1.44 | 3.27 |
| 9999.36 | 100.00 | 9999.9 | 100.00 | 9999.27 | 99.99 | |||
| *forest category consists of Dense forest and Forest Plantations | ||||||||
6.0 Conclusion:
The results of this study clearly indicated that the landuse pattern of the study area have been changed. Although detailed information can be provided only by aerial holographs the study revealed the great potential of multispectral satellite data for broad level mapping and monitoring changes in Landuse/Landcover over a period of time. Socioeconomic development as well as topographic factors may be reasons for these changes. However, due to time constraints we couldn't analysis reasons for these changes and further studies will be continued. It was not possible to compare change with multi-temporal satellite data because of the lack of multi temporal satellite images. Further improvement of the study temporal satellite data also required.
It is not possible to give the entire result as they are being analyzed and will be submitted at the conference.
References
- EASI/PACE raster image processing Software, Canada.
- Rames S. Hooda and Dennis G.Dye. Identification and Mapping of Irrigated Vegetation using NDVI-Climatological Modeling, 16th Asian Conference on Remote Sensing 1995.
- Paul Suharto and Mostafa Radwan. Digital Mapping and Topographic Database aspects in the development of spatial information systems in Indonesia.
- Alden P. Colvocoresses. Image Mapping with the Tehmatic Mapper, Photogrametic Engineering and Remote Sensing September 1986.