| GISdevelopment.net ---> AARS ---> ACRS 1996 ---> 1 KM Land Cover Data Base in Asia |
GIS of management of forest
in eastern Sri Lanka through a semi-knowledge based approach
L.K. Perera and Ryutaro
Tateishi
Weathernews Inc., D21, 1-3, Nakase, Mihama-ku, Chiba-Shi 261-01, Japan Fax: +81-43-274-5506
Center for Environmental Remote Sensing (CEReS), Chiba University, 1-33 yayoi-cho, Inage-ku,
Chiba-Shi 263, Japan. Fax: +81-43-290-3857
Abstract
Weathernews Inc., D21, 1-3, Nakase, Mihama-ku, Chiba-Shi 261-01, Japan Fax: +81-43-274-5506
Center for Environmental Remote Sensing (CEReS), Chiba University, 1-33 yayoi-cho, Inage-ku,
Chiba-Shi 263, Japan. Fax: +81-43-290-3857
Geographical information System (GIS) gives a strong approach to solve environmental problems by linking remotely sensed data with geographical data. The conventional approach is ranking these data files and merging respective classes to select most suitable to least suitable areas for some specific need. But, when the objects of the environment management become more intensive, it is important to consider the practical capability to conduct some new activity on land. By this paper, we introduce a "general value unit" approach which is based on probability calculation to merge different GIS files in order to produce a more practical land suitability map for reforestation in Sri Lanka.
Sri Lanka has a very limited forest coverage (37%) of th total land area), and this area is also decreasing at on alarming rate. Eastern Sri Lanka has many poddy lands feed with mahaveli river water. These agriculture based human activities have rendered some adverse effects to the available limited forest cover (including Wasgomuwa strict natural forest reservation) and the wild life of the are. In this study, buffer zones with practical high capability to conduct reforestation were selected and geographical data of those buffer areas were ranked through a semi-knowledge based method. The resulted land suitability map for reforestation will bring an environmental guide line for the ongoing and further environmental plans of Sri Lanka.
1.Introduction:
Decisions to change the use of land will cause great benefits or losses to many parties, not only to the mankind, but also to all living things. Land may be evaluated directly, by trial, that is by growing a crop or building a length of pipeline, to see what happens. But these kind of evaluations are based on crop or building a length of pipeline, to see what happens. But these kin of evaluations are based on inadequate information and may not be closely related to the inherent productivity of the land. Therefore most land evaluation systems are based on indirect methods which assume certain soil and site properties influence to the success of the particular land use (McRae & Burnham, 1981). Avery (1962) and Buter (1964) pointed out that there can be no general relationship between any one soil or site attribute and crop performance since very many properties influence yield and they do not act independently. Today, remote sensing and GIS (Geographical Information Systems) are playing a very significant roll in land evaluation systems such as production of land suitability maps (Perera & Tateishi, 1995).
The first sections of this paper contains a brief explanation about the methodology which was used to produce a land suitability map based on satellite data and GIS. Then some results extracted from a bigger study also included. The study area was selected from eastern Sri Lanka and covers over 9300 sq. km. of land (see figure 01). The methodology re-classifies the land with digital data processing methods, while using human knowledge and experience to make sub-divisions of each GIS file, which we could name as a 'semi-knowledge based approach' or as a 'semi-automatic approach' in other words.
2.The new approach
According to the new approach we considered that; 'all physical factors on or effect to the land are equally important'. It is important to do least changes in economically or environmentally valuable land suitability assessment. Hence, present land cover becomes the most important data file of the entire analysis. All other facts effecting to the land or related to the land can be considered with equal impotence when those elements are treated individually. This idea gives a clue to construct a new foundation to integrate GIS data file using a 'general value unit' . Also under the practical conditions, there are some land cover types those are not practical to consider in a land suitability assessment . With this background, the entire research approach can be summarized into four main divisions;
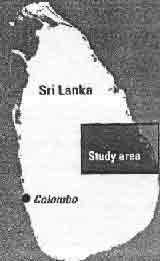
Figure. 01. Location of the study area
2.1 Generating buffer zones for reforestation and removing impractical areas.
Land cover map was produced with Landsat MSS satellite data, and DEM (Digital Elevation Model) of the area was created with 1:63,360 topo maps. Data file of Soil was digized from existence from existence analogue data and available water data file was calculated from rainfall and temperature data. River and the road network (width is 153m) were calculated from rainfall and temperature data. River and the road network (width is 153m ) were delineated from topographic maps. One pixel skipped or 153m(5 sec.) image data set, was used to produce the land cover map since the data base is covering a bigger area than the areas inserts in this study. Therefore, all other GIS files also resample and converted to that resolution. Land assign for reforestation must be conducted through a practical approach. Therefore, only most prospective lands only selected for the final classification as a set of buffer zones. Key forest cluster(including national forest reservations) in high and low mountains were encircled with 765m and 612 before zones respectively)
Forest clusters smaller these buffer zone size, were not generally considered, for reforestation, but counted as an impractical area. For reforestation (or conservation) along the river sides, 153 m land stripes were kept. The width of the buffers were decided through; (a) local and American forest inventory standards, (b) annual climatological change (c) hydrological, agricultural and population structure of the area.
As Areas impractical to change, Present forest cover, Open water, River net work, Road net work, Urbanand other densely populated areas and Lagoons and Swamp areas were isolated and removed digitally from the data base (see figure 02). The open water area is changing according to each season, Therefore a buffer zone of 2 pixels (153 x 2 m) were reserved for water expansions and another 306 m buffer zone for reforestation.
2.2. Capability classification to produce the 'general value unit'.
In five major data files in this study (Land cover, Elevation, Slope, Soil, and Water availability), there are number of sub-categories in different measuring systems such as mm, meters, degrees, etc. This different measuring systems is one of the 'bottle necks' in GIS data merging algorithms which we overcame with 'capability class approach'. All data files were re-classified into 4 to 5 classes according to the capability to carried out reforestation, with the use of local environment conditions and other published data (mac Rae and Burnham 1981, Agricultural dept. 1992, Jackson 1991). Then again re-classified these capability classes in to w major groups as High capability (Very high +High) , and Low capability (Moderate + Low + Very Low). The next step is multiply each new high and low file with main data file (High and Low categories of Land cover).Then the probability of the resulted High + High capability combination used to selected most impotent data type, under: the 'least area: highest value' policy.
2.3 Weight GIS files with a probability based point system
The probability values obtained in above process, number of maximum capability classes, and expected number of suitability classes, were used to work out a tentative point range for all GIS data files and it ranges from 8 to 45 in here. And all GIS files were ranked horizontally from 8 (land cover) to 4 (soil). Different capability classes within a single data type also were ranked using probability values. This gives sub capability classes in most important data file or 'land cover' to falls from 8 to 4 and, and least impotent file or 'soil' from 4 to 0 (avoiding '-' values) . As an example in Land cover data file, when the amount of land under Highest capable and High capable classes and High capable classes are relatively same, the Highest capable class will receive value 8 and the High capable class will receive a value very close to 8.
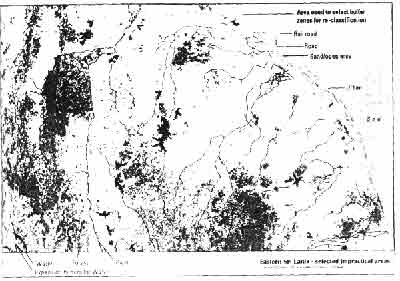
Figure 02. Distribution of the impractical area. Pixels belong to these impractical areas were removed from the selected buffer zones before those areas consider for the land suitability classification.
2.4 Final re-classification to produce the suitability maps.
At this stage the total points of each capability class becomes the upper and lover limit of a new suitability class. In this study, there are five capability classes and we obtained four Land Suitability classes. Then the final data file (which contains only selected buffer zones to be considered for reforestation), has been reclassified and produced the land suitability map (figure 04). From the beginning of the process, a great attention had given to make capability classes, to select buffer zones, and to define and remote impractical areas which resulted the area under 'Not Suitable" category with less than 1% the area.
3.The results of the case study:
Land cover map represents mainly a large rural area with large patches of paddy cultivation. South western mountains provides a considerable amount of water for the Mahaveli river net work, which flows south - north ward, bordering Wasgomuwa national forest resulted land Suitability map are presented in this report, while many information about other data types and criteria of generation capability classes were omitted to keep the length.
The land cover data file has a great importance as the base file of the study. The map is dominated by the vegetation types of the island, which has low seasonal changes. Mainly paddy cultivated areas are showing changes due to short growing season and dry season. Landsat MSS Image were digitally processed and through the Maximum Likelihood classification method Image band 1,2,3 and 4 were digitally classified into 8 land cover categories. The classification scheme was based on the image characteristics, existing land use classifications in national and international level, resolution of the data base, and other local factor. By the figure 03, Land cover map is presented and table 01 shows the area under each category. Here, it is significant that the amount of the forest (thick forest and open forest togetherness only 35%) in the study area is slightly lower than the national figure (37%), though the study the study site is a low populated rural area. The process of removing impractical areas were explained in previous sections, and final results is presented with the figure 04. As expected by the highly supervised data processing procedure, 'Not Suitable' class contains only less that 1% of the selected area. The table 01 contains the area calculation of land cover map and land suitability map.
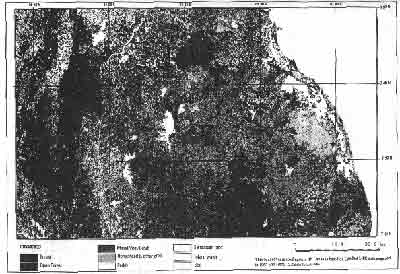
Figure 03. Land cover Map of Eastern Sri Lanka
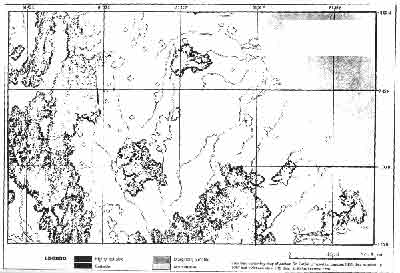
Figure 04. Land suitability map for reforestation in Eastern Sri Lanka
Table 01. Area calculations of Land cover map and Land suitability map.
| Land cover type | Area in sq. km. | % | Land suitability | Area in sq. km. | % |
| Forest | 2756 | 29 | High Soutable | 275.1 | 25.59 |
| Open forest | 1099 | 12 | Suitable | 557.3 | 51.84 |
| Mixed vegetation/Scrub | 1918 | 21 | Marginally Suitable | 241.8 | 22.49 |
| Homest. & Other crop | 2197 | 23 | Not Suitable | 0.9 | 00.08 |
| Paddy | 1108 | 12 | |||
| Sand/Open area | 128 | 01 | |||
| Inland Water | 165 | 02 | |||
| Total(without sea area) Total area including sea |
9371 108992 |
100 | Total selected area | 1075.1 | 100.00 |
According to the results, the forest cover of the area can be increased up to 3588 sq. km with only directing Highly suitable and Suitable areas for reforestation. According to the locations of upper suitable classes, it is clear that reforestation activities in that area will be highly effective to the hydrological resource of the area. Form the environmental point of view, it is time to realize the importance and implement the conservation and reforestation activities in mountain slopes of the island, as we emphasized in this study.
The methodology explained in this study will be presented in detail in a different research paper. This method can be implemented in any environment of the world with slight change according to the local conditions.
References
- Department of Agriculture, 1990, Crop recommendations technoguide, Dept. of Agriculture, Sri Lanka.
- Jackson, I.J., 1993, Climate, Water, and Agriculture in the Tropics, Second Edition, Longman Publication, Essex, England
- McRae, S.G. and Burnham, C.P. 1981, Land evaluation, Oxford University press, Oxford, U.K.
- Perera, L.K. Tsuchiya, K., Toyota, H. (1992): Identification of Forest Cover Change by Landsat MSS Data and Environmental Effects of such changes in Central South Sri Lanka. Journal of Geography, Tokyo Geographical Society, Vol. 101 N. 4,307-317.
- Perera, L.K. and Tateishi, R. (1994): Do remote sensing and GIS have a practical applicability in developing countries ? (including some Sri Lankan experience), Int. Journal of Remote Sensing. Taylor & Francis, Vol. 16, 1, 18-35.