| GISdevelopment.net ---> AARS ---> ACRS 1996 ---> Global Environment |
Scaling of NDVI and VSW index
between LANDSAT TM and NOAA AVHRR data
Mikio Sugita, Yoshifumi Yasuoka, Yoshiki Yamagata Yamagata and Masayuki Tamura
National Institute for Environemental Studies
Onogawa 16-2, Tsukuba, Ibaraki 305, Japan
Te; : +81-298-50-2589, Fax: +298-51-2572,
E-mail : sugita@nies.go.jp
Mikio Sugita, Yoshifumi Yasuoka, Yoshiki Yamagata Yamagata and Masayuki Tamura
National Institute for Environemental Studies
Onogawa 16-2, Tsukuba, Ibaraki 305, Japan
Te; : +81-298-50-2589, Fax: +298-51-2572,
E-mail : sugita@nies.go.jp
Abstract
A scaling method was investigated to extrapolate the local information based on the fine spatial resolution data to more global scale by using coarse spatial resolution data covering wider area. In this case study, LANDSAT TM data was overlayed with NOAA AVHRR data, and the local landcover information derived from TM was extrapolated to continental scale with AVHRR data. As an efficient landcover property to correlate data from different spatial scale, the VSW index was applied which is a newly developed vegetation index reflecting the vegetation conditions as well as soil and water conditions. The VSW indices from both of TM and AVHRR data were compared and correlation between them was investigated. The result shows that the VSW indices from TM and AVHRR data correlated more than the NDVIs from the TM and AVHRR data.
1. Introduction
Deforestation, desertification and land degradation have been critical global environmental issues during the past decade. Monitoring and cover conditions and their changes is esential to the management of the environmental problems in both of the local and global scale. It is, however, no easy to monitor land conditions over large areas.
In the previous paper (Yasuila et al., 1995), we investigated a remote sensing method (scaling), which extrapolated the local information based on the fine spatial resolution data from LANDSAT TM to more global scale by using coarse spatial resolution data from NOAA AVHR covering wider area. The results indicated that pixel value of NOAA AVHRR data show linear relation with mixture condition among vegetation, soil and water from LANDSAT TM data. To find efficient properties useful for the scaling technique, it is necessary to examine which properties show evident relation when the properties are taken from sensors with different spatial resolution.
In this study, we applied scaling method to VSW index which is a newly developed index reflecting the vegetation conditions as well as soil and water conditions. The VSW indices from TM and AVHRR data were comapred and correlation between them was investigated taking area around Khon Kaen as a test site. In this paper, first, the VSW index is introduced and next, several property pairs from AVHRR and TM data are compared to find the efficient property for scaling.
2. VSW Index (Vegetation-Soil-Water Index)
Many vegetation indices, using red and infrared reflectance, have been devised to monitor land cover condition, especially vegetation. Ratio Index Normalized Difference Vegetation Index (NDVI) and Perendicular Vegetatin Index (PVI) are among the well-known indices of this type. The PVI (Richardson et al., 1977) was defined as the distance from the soil line on a scatter plot of near infrared (NRI) versus red reflectance (Fig. 1). The PVI was developed as a vegetation index to effectively (Fig. 1). The PVI was developed as a vegetation index to effectively monitor the vegetation biomass without affected by differences in soil index to effectively monitor the vegetation biomass without being affected by differences in soil background.
Fig. 1. Relationship between PV1 and the soil line in a NIR-Red scatter plot
Yamagata et al. Devised a new index called a Vegetation-Soil -Water (VSW) index to monitor to monitor land cover conditions (Yamagata et al., in press). The VSW index is defined as a natural extension of PV1 for monitoring not only vegetation conditions but also soil and water conditions as well. The definition of VSW index is shown in Fig.2., which shows the relationship between VSW indices and the end member triangle on a NRI-Red Scatter Plot.
Fig. 2. Relationship between VSW indices and the end member traingle or NIR-Red Scatter plot.
The PVI measure only vegetation parameters, whereas the VSW index monitors vegetation, soil and water parameters simultaneously by measuring the distances PV, PS and PW vegetation water and soil, respectively.
3. Cross Comparison of DN, NDVI and VSW index between AVHRR and TM data
LANDSAT TM data of February 9, 1990 and NOAA AVHRR data of February 1, 1990 over Khon Kaen area in Thailand were geometrically corrected and overlayed so that one pixel of AVHRR covers a set of TM pixels in a rectangular block of 35x36 (Fig.3). Spatial resolution of one pixel of AVHRR is around 1.1 kilometers and that of TM is around 30 meters. Spatial resolution of one pixel of AVHRR is around 1.1 kilometers and that of TM is around 30 meters. Then the relations between each pixel of AVHRR and corresponding block of 36x36 pixels of TM were statistically investigated for the following properties, Digital Number (DN) in each channel of satellite sensor,
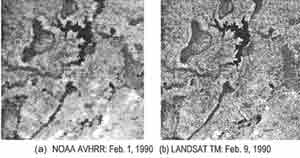
Fig. 3. Image overlay between NOAA AVHRR and LANDSAT TM Over Knon Kaen inThailand (AVHRR 1920/2/1, TM: 1990/2/9.
NDVI, mixing ratio of three land cover categories and VSW Index. DN used in this analysis are AV1, A V2, TM2, TM3, and TM4, which indicate DNs for NOAA AVHRR band 1 and 2, and LANDSAT TM band 2, 3 and r, respectively. NDVI are defined for AVHRR and TM by
NDVI_AVHRR = (AV2-AV1) / (AV2+AV1),
NDVI_TM =(TM4-TM3) / (TM4 + TM3). (1)
Land cover for each of three categories (vegetation cover, soil cover and water cover) is determined based on the maximum likelihood classification result of TM data. VSW indices (PV, PS, PW) are calculated using end member spectral points for vegetation, soil and water with an algorithm to fit a triangle to the NIR-Red spectral distribution. Fig. 4. Shows a example of VSW index image for vegetation (PV) calculated from Fig. 3. The brighter area in this image coincides with the more vegetated area.
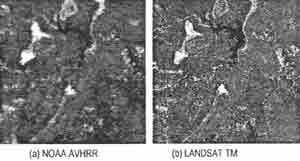
Fig. 4. Mapped image of VSW Index for vegetation. The brighter area coincide with the more vegetated area.
Linear correlation of corresponding properties between AVHRR and TM data is examined for the property pairs listed below;
(1) TM band 2 DN and AVHRR band 1 DN
(2) TM band 2 DN and AVHRR band 1 DN
(3) TM band 4 DN and AVHRR band 2 DN
(4) TM NDVI and AVHRR NDVI
(5V) TM vegetation cover and AVHRR PV
(5S) TM soil cover and AVHRR PS
(5W) TM water cover and AVHRR PW
(6V) TM PV and AVHRR PV
(6S) TM PS and AVHRR PS
(6W) TM PW and AVHRR PW
For a value of a property from a given pixel of AVHRR, the average value of the property, which should be correlated, over corresponding 36 x 36 TM pixel block are taken, and correction between them is investigated using data over the area shown in Fig. 3. The result is summarized in table 1.
Table 1. Linear correlation of corresponding properties between
AVHRR and TM data.
From a viewpoint of scaling technique, 1-to-1 relation of properties between AVHRR and TM data is demanded. The aim in comparing correlation of the properties between AVHRR and TM data is, therefore to find the property which shows the highest correlation coefficient, the slope nearest to 1.0 and the interest to 0. Table 1 tells us that the pair (3) shows the strongest correlation and the pair (1) gives the slope nearest to 1.0. it is so general that any combinations of sensor band in one satellite or among satellite have strong correlation. The VSW indices shows the correction coefficients as high as the sensor band combinations between AVHRR and TM do, and significantly higher than NDVI does. The value of intersect, however, cannot be compared at this point l, because the dynamic range of properties used in this analysis is not same. Normalization of property value must be done before the comparison. The result suggested that the VSW indices from AVHRR and TM have close relation similar to 1-to 1 relation and directly compared between AVHRR and TM data. This result also supports that the VSW index can be effectively utilized as a comparison key for scaling method.
4. Conclusion
We applied the scaling method to the VSW index which reflects the vegetation conditions as well as soil and water conditions. The VSW indices from TM and AVHRR data were compared and correlation between them was investigated. The result shows that the VSW indices from TM and AVHRR data correlated more than the NDVIs from TM and AVHRR data. The authors conclude that the VSW index is a useful property for scaling method. It is important to assess this conclusion using he VSW index in scaling method.
Acknowledgement
This study is carried out as a part of the research project "Global Monitoring and Mapping of Wetlands by Remote Sensing" Supported by the Japan Environment Agency (Global Environment Research Found).
References
A scaling method was investigated to extrapolate the local information based on the fine spatial resolution data to more global scale by using coarse spatial resolution data covering wider area. In this case study, LANDSAT TM data was overlayed with NOAA AVHRR data, and the local landcover information derived from TM was extrapolated to continental scale with AVHRR data. As an efficient landcover property to correlate data from different spatial scale, the VSW index was applied which is a newly developed vegetation index reflecting the vegetation conditions as well as soil and water conditions. The VSW indices from both of TM and AVHRR data were compared and correlation between them was investigated. The result shows that the VSW indices from TM and AVHRR data correlated more than the NDVIs from the TM and AVHRR data.
1. Introduction
Deforestation, desertification and land degradation have been critical global environmental issues during the past decade. Monitoring and cover conditions and their changes is esential to the management of the environmental problems in both of the local and global scale. It is, however, no easy to monitor land conditions over large areas.
In the previous paper (Yasuila et al., 1995), we investigated a remote sensing method (scaling), which extrapolated the local information based on the fine spatial resolution data from LANDSAT TM to more global scale by using coarse spatial resolution data from NOAA AVHR covering wider area. The results indicated that pixel value of NOAA AVHRR data show linear relation with mixture condition among vegetation, soil and water from LANDSAT TM data. To find efficient properties useful for the scaling technique, it is necessary to examine which properties show evident relation when the properties are taken from sensors with different spatial resolution.
In this study, we applied scaling method to VSW index which is a newly developed index reflecting the vegetation conditions as well as soil and water conditions. The VSW indices from TM and AVHRR data were comapred and correlation between them was investigated taking area around Khon Kaen as a test site. In this paper, first, the VSW index is introduced and next, several property pairs from AVHRR and TM data are compared to find the efficient property for scaling.
2. VSW Index (Vegetation-Soil-Water Index)
Many vegetation indices, using red and infrared reflectance, have been devised to monitor land cover condition, especially vegetation. Ratio Index Normalized Difference Vegetation Index (NDVI) and Perendicular Vegetatin Index (PVI) are among the well-known indices of this type. The PVI (Richardson et al., 1977) was defined as the distance from the soil line on a scatter plot of near infrared (NRI) versus red reflectance (Fig. 1). The PVI was developed as a vegetation index to effectively (Fig. 1). The PVI was developed as a vegetation index to effectively monitor the vegetation biomass without affected by differences in soil index to effectively monitor the vegetation biomass without being affected by differences in soil background.
Fig. 1. Relationship between PV1 and the soil line in a NIR-Red scatter plot
Yamagata et al. Devised a new index called a Vegetation-Soil -Water (VSW) index to monitor to monitor land cover conditions (Yamagata et al., in press). The VSW index is defined as a natural extension of PV1 for monitoring not only vegetation conditions but also soil and water conditions as well. The definition of VSW index is shown in Fig.2., which shows the relationship between VSW indices and the end member triangle on a NRI-Red Scatter Plot.
Fig. 2. Relationship between VSW indices and the end member traingle or NIR-Red Scatter plot.
The PVI measure only vegetation parameters, whereas the VSW index monitors vegetation, soil and water parameters simultaneously by measuring the distances PV, PS and PW vegetation water and soil, respectively.
3. Cross Comparison of DN, NDVI and VSW index between AVHRR and TM data
LANDSAT TM data of February 9, 1990 and NOAA AVHRR data of February 1, 1990 over Khon Kaen area in Thailand were geometrically corrected and overlayed so that one pixel of AVHRR covers a set of TM pixels in a rectangular block of 35x36 (Fig.3). Spatial resolution of one pixel of AVHRR is around 1.1 kilometers and that of TM is around 30 meters. Spatial resolution of one pixel of AVHRR is around 1.1 kilometers and that of TM is around 30 meters. Then the relations between each pixel of AVHRR and corresponding block of 36x36 pixels of TM were statistically investigated for the following properties, Digital Number (DN) in each channel of satellite sensor,
Fig. 3. Image overlay between NOAA AVHRR and LANDSAT TM Over Knon Kaen inThailand (AVHRR 1920/2/1, TM: 1990/2/9.
NDVI, mixing ratio of three land cover categories and VSW Index. DN used in this analysis are AV1, A V2, TM2, TM3, and TM4, which indicate DNs for NOAA AVHRR band 1 and 2, and LANDSAT TM band 2, 3 and r, respectively. NDVI are defined for AVHRR and TM by
NDVI_TM =(TM4-TM3) / (TM4 + TM3). (1)
Land cover for each of three categories (vegetation cover, soil cover and water cover) is determined based on the maximum likelihood classification result of TM data. VSW indices (PV, PS, PW) are calculated using end member spectral points for vegetation, soil and water with an algorithm to fit a triangle to the NIR-Red spectral distribution. Fig. 4. Shows a example of VSW index image for vegetation (PV) calculated from Fig. 3. The brighter area in this image coincides with the more vegetated area.
Fig. 4. Mapped image of VSW Index for vegetation. The brighter area coincide with the more vegetated area.
Linear correlation of corresponding properties between AVHRR and TM data is examined for the property pairs listed below;
(1) TM band 2 DN and AVHRR band 1 DN
(2) TM band 2 DN and AVHRR band 1 DN
(3) TM band 4 DN and AVHRR band 2 DN
(4) TM NDVI and AVHRR NDVI
(5V) TM vegetation cover and AVHRR PV
(5S) TM soil cover and AVHRR PS
(5W) TM water cover and AVHRR PW
(6V) TM PV and AVHRR PV
(6S) TM PS and AVHRR PS
(6W) TM PW and AVHRR PW
For a value of a property from a given pixel of AVHRR, the average value of the property, which should be correlated, over corresponding 36 x 36 TM pixel block are taken, and correction between them is investigated using data over the area shown in Fig. 3. The result is summarized in table 1.
| TM property | AVHRR property | Correlation coefficient | slope | Interest | |
| (1) | Band 2 DN | Band 1 DN | 0.89 | 1.05 | 6.28 |
| (2) | Band 3 DN | Band 1 DN | 0.90 | 0.65 | 7.67 |
| (3) | Band 4 DN | Band 2 DN | 0.91 | 0.76 | 16.12 |
| (4) | NDVI | NDVI | 0.87 | 0.63 | 0.14 |
| (5v) | Vegetation cover | PV | 0.60 | 0.39 | 66.30 |
| (5s) | Soil cover | PS | 0.72 | 0.51 | 18.38 |
| (5w) | Water cover | PW | 0.78 | 0.62 | 42.09 |
| (6v) | PV | PV | 0.80 | 0.90 | 13.85 |
| (6s) | PS | PS | 0.90 | 0.98 | 29.20 |
| (6w) | PW | PW | 0.89 | 0.88 | -22.74 |
From a viewpoint of scaling technique, 1-to-1 relation of properties between AVHRR and TM data is demanded. The aim in comparing correlation of the properties between AVHRR and TM data is, therefore to find the property which shows the highest correlation coefficient, the slope nearest to 1.0 and the interest to 0. Table 1 tells us that the pair (3) shows the strongest correlation and the pair (1) gives the slope nearest to 1.0. it is so general that any combinations of sensor band in one satellite or among satellite have strong correlation. The VSW indices shows the correction coefficients as high as the sensor band combinations between AVHRR and TM do, and significantly higher than NDVI does. The value of intersect, however, cannot be compared at this point l, because the dynamic range of properties used in this analysis is not same. Normalization of property value must be done before the comparison. The result suggested that the VSW indices from AVHRR and TM have close relation similar to 1-to 1 relation and directly compared between AVHRR and TM data. This result also supports that the VSW index can be effectively utilized as a comparison key for scaling method.
4. Conclusion
We applied the scaling method to the VSW index which reflects the vegetation conditions as well as soil and water conditions. The VSW indices from TM and AVHRR data were compared and correlation between them was investigated. The result shows that the VSW indices from TM and AVHRR data correlated more than the NDVIs from TM and AVHRR data. The authors conclude that the VSW index is a useful property for scaling method. It is important to assess this conclusion using he VSW index in scaling method.
Acknowledgement
This study is carried out as a part of the research project "Global Monitoring and Mapping of Wetlands by Remote Sensing" Supported by the Japan Environment Agency (Global Environment Research Found).
References
- Richardson, A.J. and Wiegand, C.L. (1977) Distinguishing vegetation from soil background information, Photogram. Engineer. Remote Sensing, 43:15410-1552.
- Yamagata, Y., Sugita, M. and Yasuoka, Y. (in press) Land cover monitoring usign vegetation Soil-Water Index. J. Remote Sensing Soc. Jpn. (in Japanese with English abstract).
- Yasuoka, Y., Sugita, M. et al. (1995) Scaling between NOAA AVHRR and LANDSAT TM data for monitoring and mapping of wetland. Proc. Internatinal Symposium on Vegetation Monitoring. Chiba, Japan.