| GISdevelopment.net ---> AARS ---> ACRS 1996 ---> Global Environment |
Relation between social
conditions and the vegetation environment in Colombo city, using Remote
Sensing data
Makoto Kawamura1, Sanath Jayamanna1, Yuji Tsujiko1
1Toyohashi University of Technology
Tempaku Cho Toyohashi Shi
Aichi 441, Japan
Fax: +81-532-44-6831,
E-mail : r937654@res.tutcc.tut.ac.jp
Makoto Kawamura1, Sanath Jayamanna1, Yuji Tsujiko1
1Toyohashi University of Technology
Tempaku Cho Toyohashi Shi
Aichi 441, Japan
Fax: +81-532-44-6831,
E-mail : r937654@res.tutcc.tut.ac.jp
Abstract
The distribution of vegetation within an urban area plays a major role in providing a satisfactory environmental condition within the urban area for its inhabitants. In most cities however, these vegetation areas are threatened by alternate urban land use due to pressure on land. In this study social parameters of an urban area are related with the density of urban vegetation in the respective planning units of the city using a vegetation cover map. By this, areas having a poor environmental condition could be easily recognised and the environmental condition of the city as a whole could be assessed. Further, it is shown how satellite data could be related with social parameters and the density of urban vegetation so that these relations could be used for continuous environmental monitoring of the urban are. To achieve this, the authors have used a proposed index UI, computed by using Landsat TM band 7 and 4 and the modified Soil adjusted Vegetation index (MSAVI). As a case study the City of Colombo in Sri Lanka is used.
1.0 Introduction
In recent times the importance of urban vegetation in preventing he deterioration the deterioration of the urban environment as been rcognised. Vegetation in urban areas strongly controls the hermal environment, it helps in the retention of rainfall runoff and reduces the level of suspended particles in the atmosphere. Hence the quantity and quality of urban vegetation and economic activity distress.
In this study social parameters of planning units of the City of Colombo in Sri Lanka has been related with the density of urban vegetation so that the areas having a poor environmental condition could be easily recognised. Further it is shown that this relation could be represented by a relation between a proposed index UI and MSAVI both computed using Landsat TM data so that these areas could be continually monitored using satellite data. UI is strongly related to social and other parameters of development while MSAVI is related to the vegetation density.
The study area was limited to the Municipal Council Limits of the city of Colombo which has an area 37.7 sq.km with a population of 635000. Figure 1 shows the planning units within the city. The vegetation within the city consists of parks, grasslands, mixed agricultural crops, mangroves deep and shallow marshes and artificial green. The distribution of vegetaion within the city is shown in figure 2 which is an urban vegetation map of 1981 and was used in this study.
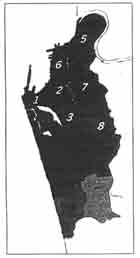
Figure 1 Planning units within Colombo City
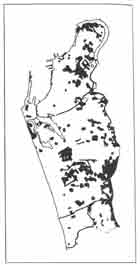
Figure 2 Distribution of Urban Vegetation in Colombo City, 1981
Table 1 Social and environmental parameters
2.0 Data used in the study
2.1 Conventional Data
To compute the density vegetation in the respective planning units an urban vegetation map of 1981 of Colombo City (Fig.2) was used. A map showing the planning units within the city was scanned and registered with other spatial data to compute by using a 1:12672 building cover map of 1970. Population and housing data of 1993 and slum and shanty population data of 1981 was used in the analysis.
2.2 Remote Sensing Data
A Landsat TM scene over the colombo materopolitan regon quired on the 12 the February 1992 was used in the analysis.
2.2.1 the proposed Index UI
The proposed index UI was computed as shown below using Landsat TM band 7 and 4.
UI is strongly related to the density of building cover (UD) as could be seen the figure 10 in section 4.1. To obtain this figure the scanned image of the building cover map and themap showing the planing units have been registered with the Landsat TM image. Figure in section 4.1 show how UI is related to social parameters of this urban area.
2.2.2 The modified soil adjusted vegetation index (MSAVI)
The Modified Soil Adjusted Vegetation Index (MSAVI) has been proposed by Qi et al [2] minimise soil background influences on NDVI. It increases the dynamic range of the vegetation sensitivity. MSAVI is defined and used in this study as shown below.
where B4 and B3 refer to Landsat TM Bands 4 and 4 and 3 respectively.
3.0 Relation between social conditons and the vegetation environment using conventional data
To compute the urban vegetation density (UVD) and building cover density (UV) in each planning unit the maps showing the distribution of vegetation and the distribution of buildings have been scanned and registered with a scanned map showing the planning units. Social data relating to the planning units have been used to obtain the relations shown in the following figures. Points showing low population and housing densities and also low vegetation densities shown by à were found to be commercial areas, namely, Maradana(3) Killupitiya(4) Bambalapitiya(1) and wellawatta (11). It could be seen in the reltion between building cover density (UD) and density and low vegetationdensity. In figures 3 and 4 it could be seen tht in oher areas shown by ·, namely, kochikade. Form theis the overcrowded and poor environemtnal conditions in this area could be recognised. Points showing low population and housing densitites and high urban vegetatin densities shown by n in figure 3 and 4 are cinamon Gardens and narahenpita. Cnnamon Gardens is a high class residential area while narahenpita is a presently expanding residential area.
Figure 3 Relation between Population Density and Urban Vegetation Density
Figure 4 Relation between Population Density and Urban Vegetation Density
4.0 Relation Between Social Conditions And The Vegetation Environment Using Remote Sensing Data.
4.1 Relation between UI and social parameters
The scanned image of the map showing the planning units in Colombo was registered with the landsat TM image and the average UI and MSAVI values for each planning unit was unit was computed. Average UI values for larger administrative units in the Colombo Metropolitan Region was also computed. Then using social data relation to these units the following figures have been obtained they show that UI is strongly related to parameters of development.
4.2 Relation between MSAVI and the urban vegetation density
The relation between MSAVI and urban vegetation density is shown in figure 11 and it is seen that MSAVI is strongly related to the vegetation density as expected.
4.3 Relation between and MSAVI
The relation between UI and MSAVI is seen in Figure 12. The areas with low MSAVI and high UI particularly the one shown by l is the same as the one seen in figures 3,4 and 5 representing the overcrowded and environmentally poor Kochchikade area. Whereas the areas with high MSAVI and low UI shown by n in figure 12 represent Cinnamon Gardens and Narahenpita both areas with high environmental quality as explained by figure 3, 4 and 5. Therefore the relation between UI and MSAVI both computed using Satellite Remote Sensing data represents the relation between social conditions and the vegetation environment in the Colombo City.
Figure 5 Relation between Slum Population Density and Urban Vegetation Density
Figure 6 Relation between Urban Density and Urban Vegetation Density
Figure 7 Relation between Urban Index (UI) and Population Density
Figure 8 Relation between Urban Index (UI) and Housing Density
Figure 9 Relation between Urban Index (UI) and Slum Population Density
Figure 10 Relation between UI and Urban Density
Figure 11 Relation between MSA VI and Urban Vegetation Density
Figure 12 Relation between UI and MSAVI
5.0 Conclusion
From this study it could be seen that the social and environmental conditions that could be identified using conventional data could be recongnised by satellite Remote Sensing data, thereby providing a means of continuous monitoring of the urban area.
References
The distribution of vegetation within an urban area plays a major role in providing a satisfactory environmental condition within the urban area for its inhabitants. In most cities however, these vegetation areas are threatened by alternate urban land use due to pressure on land. In this study social parameters of an urban area are related with the density of urban vegetation in the respective planning units of the city using a vegetation cover map. By this, areas having a poor environmental condition could be easily recognised and the environmental condition of the city as a whole could be assessed. Further, it is shown how satellite data could be related with social parameters and the density of urban vegetation so that these relations could be used for continuous environmental monitoring of the urban are. To achieve this, the authors have used a proposed index UI, computed by using Landsat TM band 7 and 4 and the modified Soil adjusted Vegetation index (MSAVI). As a case study the City of Colombo in Sri Lanka is used.
1.0 Introduction
In recent times the importance of urban vegetation in preventing he deterioration the deterioration of the urban environment as been rcognised. Vegetation in urban areas strongly controls the hermal environment, it helps in the retention of rainfall runoff and reduces the level of suspended particles in the atmosphere. Hence the quantity and quality of urban vegetation and economic activity distress.
In this study social parameters of planning units of the City of Colombo in Sri Lanka has been related with the density of urban vegetation so that the areas having a poor environmental condition could be easily recognised. Further it is shown that this relation could be represented by a relation between a proposed index UI and MSAVI both computed using Landsat TM data so that these areas could be continually monitored using satellite data. UI is strongly related to social and other parameters of development while MSAVI is related to the vegetation density.
The study area was limited to the Municipal Council Limits of the city of Colombo which has an area 37.7 sq.km with a population of 635000. Figure 1 shows the planning units within the city. The vegetation within the city consists of parks, grasslands, mixed agricultural crops, mangroves deep and shallow marshes and artificial green. The distribution of vegetaion within the city is shown in figure 2 which is an urban vegetation map of 1981 and was used in this study.
Figure 1 Planning units within Colombo City
Figure 2 Distribution of Urban Vegetation in Colombo City, 1981
| Unit No. | Name of Planning Unit | Area | Population Density (people/ha) | Houssing Densign (unit/ha) | Slum and Shanty Population Density (people/ha) | Building Density (%) | Urban Vegetation Density (%) | UI | MSAVI |
| 1 | Fort | 179 | - | - | 12 | 79.7 | 5.19 | 80.58 | 92.7 |
| 2 | Kochchikde | 159 | 590 | 104 | 310 | 93.01 | 0.81 | .15 | 92.77 |
| 3 | Maradaua | 214 | 263 | 34 | 125 | 7.98 | 2.85 | 1.41 | 103.20 |
| 4 | Kollupitiya | 291 | 190 | 26 | 82 | 82.97 | 8.63 | 79.29 | 100.26 |
| 5 | Mattakkuliya | 380 | 182 | 26 | 95 | 7118 | 15.44 | 72.28 | 119.91 |
| 6 | Kotahen | 170 | 235 | 36 | 89 | 74.73 | 2.55 | 80.01 | 102.19 |
| 7 | Grandpas | 533 | 248 | 44 | 98 | 68.81 | 14.75 | 75.47 | 111.21 |
| 8 | Borella | 156 | 209 | 28 | 84 | 78.55 | 13.06 | 72.53 | 122.07 |
| 9 | Ciunamou Gardens | 343 | 57 | 6 | 6 | 61.96 | 21.17 | 72.67 | 122.19 |
| 10 | Bambalapitiya | 238 | 124 | 16 | 6 | 88.23 | 0.94 | 77.21 | 109.91 |
| 11 | Wellawatte | 335 | 165 | 24 | 27 | 82.29 | 4.55 | 77.87 | 114.10 |
| 12 | Naraherrpita | 354 | 93 | 11 | 25 | 59.68 | 26.59 | 68.88 | 128.25 |
2.0 Data used in the study
2.1 Conventional Data
To compute the density vegetation in the respective planning units an urban vegetation map of 1981 of Colombo City (Fig.2) was used. A map showing the planning units within the city was scanned and registered with other spatial data to compute by using a 1:12672 building cover map of 1970. Population and housing data of 1993 and slum and shanty population data of 1981 was used in the analysis.
2.2 Remote Sensing Data
A Landsat TM scene over the colombo materopolitan regon quired on the 12 the February 1992 was used in the analysis.
2.2.1 the proposed Index UI
The proposed index UI was computed as shown below using Landsat TM band 7 and 4.
UI is strongly related to the density of building cover (UD) as could be seen the figure 10 in section 4.1. To obtain this figure the scanned image of the building cover map and themap showing the planing units have been registered with the Landsat TM image. Figure in section 4.1 show how UI is related to social parameters of this urban area.
2.2.2 The modified soil adjusted vegetation index (MSAVI)
The Modified Soil Adjusted Vegetation Index (MSAVI) has been proposed by Qi et al [2] minimise soil background influences on NDVI. It increases the dynamic range of the vegetation sensitivity. MSAVI is defined and used in this study as shown below.
where B4 and B3 refer to Landsat TM Bands 4 and 4 and 3 respectively.
3.0 Relation between social conditons and the vegetation environment using conventional data
To compute the urban vegetation density (UVD) and building cover density (UV) in each planning unit the maps showing the distribution of vegetation and the distribution of buildings have been scanned and registered with a scanned map showing the planning units. Social data relating to the planning units have been used to obtain the relations shown in the following figures. Points showing low population and housing densities and also low vegetation densities shown by à were found to be commercial areas, namely, Maradana(3) Killupitiya(4) Bambalapitiya(1) and wellawatta (11). It could be seen in the reltion between building cover density (UD) and density and low vegetationdensity. In figures 3 and 4 it could be seen tht in oher areas shown by ·, namely, kochikade. Form theis the overcrowded and poor environemtnal conditions in this area could be recognised. Points showing low population and housing densitites and high urban vegetatin densities shown by n in figure 3 and 4 are cinamon Gardens and narahenpita. Cnnamon Gardens is a high class residential area while narahenpita is a presently expanding residential area.
Figure 3 Relation between Population Density and Urban Vegetation Density
Figure 4 Relation between Population Density and Urban Vegetation Density
4.0 Relation Between Social Conditions And The Vegetation Environment Using Remote Sensing Data.
4.1 Relation between UI and social parameters
The scanned image of the map showing the planning units in Colombo was registered with the landsat TM image and the average UI and MSAVI values for each planning unit was unit was computed. Average UI values for larger administrative units in the Colombo Metropolitan Region was also computed. Then using social data relation to these units the following figures have been obtained they show that UI is strongly related to parameters of development.
4.2 Relation between MSAVI and the urban vegetation density
The relation between MSAVI and urban vegetation density is shown in figure 11 and it is seen that MSAVI is strongly related to the vegetation density as expected.
4.3 Relation between and MSAVI
The relation between UI and MSAVI is seen in Figure 12. The areas with low MSAVI and high UI particularly the one shown by l is the same as the one seen in figures 3,4 and 5 representing the overcrowded and environmentally poor Kochchikade area. Whereas the areas with high MSAVI and low UI shown by n in figure 12 represent Cinnamon Gardens and Narahenpita both areas with high environmental quality as explained by figure 3, 4 and 5. Therefore the relation between UI and MSAVI both computed using Satellite Remote Sensing data represents the relation between social conditions and the vegetation environment in the Colombo City.
Figure 5 Relation between Slum Population Density and Urban Vegetation Density
Figure 6 Relation between Urban Density and Urban Vegetation Density
Figure 7 Relation between Urban Index (UI) and Population Density
Figure 8 Relation between Urban Index (UI) and Housing Density
Figure 9 Relation between Urban Index (UI) and Slum Population Density
Figure 10 Relation between UI and Urban Density
Figure 11 Relation between MSA VI and Urban Vegetation Density
Figure 12 Relation between UI and MSAVI
5.0 Conclusion
From this study it could be seen that the social and environmental conditions that could be identified using conventional data could be recongnised by satellite Remote Sensing data, thereby providing a means of continuous monitoring of the urban area.
References
- Kawamura Makoto, Jayamanna Sanath and Tsujiko Juji, (1996) Relation Between Social and Environmental Conditons inColombo, Sri Lanka and the Urban Index Estimated by Satellite Remote Sensing Data, International Archives of Photogrammetry and Remote Sensing, XXXI(B7), pp. 321-326.
- Qi,J., Chehbouni A, Huete A.R. Kerr Y.H, Sorooshian, 1994, A Modified Soil Adjusted Vegetation Index, Remote Sensing Environment, Vol. 48, p119-126.