| GISdevelopment.net ---> AARS ---> ACRS 1996 ---> Global Environment |
Analysis of urbanization
trend in the greater Colombo area from 1956-1994 using air photos
Malik Majeed (MITP)
Malik Majeed (MITP)
1. Introduction
1.1 Background
Urban areas in Sri Lanka are declared on the basis of administrative units. However, there has been no such declaration in more than 20 years although this has been a period of considerable urban development. Further, there is no census data available after 1981, which would have provided recent information on urbanization even on the basis of administrative units.
Under these circumstances, other sources of data which help define and delineate urban areas assume greater importance. This paper analyses the trends of urbanization in the Greater Colombo area by the use of air-photos of 1956 (1:50,000), 1981 (1:40,000) and 1994 (1:20,000).
1.2 Advantage of Air-Photos
Air-photos (APs) which are now widely used as a data source in many fields have the following advantage over field surveys.
Considering the purpose of the study and the source of data, urban areas were defined as follows.
The analysis is based primarily on the map of urbanizatin trend produced by the interpretation of APs. It deals first with the urban situation in 1956 followed by the ubanization in the periods 1956-1981 and 1981-1984.
2.1 Urban Area in 1956
The urban area in 1956 included Colombo city, Nugegoda, Dehiwela/Mt Lavinia municipal council area excluding Attidiya and pars of Moratuwa urban council area. In addition there were mainly, the satellite towns of Negombo, Gampaha, Ragama, Panadura and Kalutara.
The urban area added upto 7,200 ha in 1956 and comprised 5% of the study area which covered a major part of the Western Province. The urban core (ie: block of continues built-up area) made up 75% of the urban area reflecting the urban concentration around Colombo.
2.2 Urban from 1956-1981
During this period, the urban core area expanded upto Kerawalapitiaya (2.5 km north of Wattala) in the north, Kotikawate in the east, Navinna in the south -east and Egoda Uyana (2.5 km north of Panadura) in the south.
This increase was the result of ribbion development along Colombo-Katunayake road from Welisara to Ja-ela and again from Seeduwa to Negombo and along Galle road from Kudawaskaduwa to Katukurunda. There was growth around Kalutara town as well. In areas east and south-east of Bolombo, there was considerable ribbon development along secondary roads too.
In extent, the total urban area had grown to 21,400 ha, covering 15% of the study area. This represented a 200% increase over the 25 years, or a annual increase of 8%.
2.3 Urbanization from 1981 and 1994.
During this period the core area had expanded upto Hokandara in the east, beyond Kesbewa in the south-east and Pinwata in the south. The continuous northward expansion of the core has been constrained by the Muthurajawela marsh. The area within a 10 km radius of Colombo is almost completely urban.
In the outer areas, ribbon development was pronounced along Ja-ela-Minuwangoda road, Negombo-Minuwangoda road, Colombo-Kandy road, High Level road and Panadura -Horana road. Further there was urban expansion around Gampaha town, around Airpor at Katunayake, and around Kalutara town.
During he thirteen years upto 1994, the urban area had increased to 35,900 ha. Comprising 25% of the study area. This represented an increase of 68% over the 1981 figure and an annual increase of 5% between 1881 and 1994.
2.4 Types of Land Converted to Urban Use
North and north-east of Colombo, about 70% of the conversions to urban use were from highlands (coconut lands etc.) and the rest from village settlements.
To the east and south-east, conversion to urban use was mostly from village settlements. This explains the densified development in the south-east considering also that about 570 ha of lands in this part are declared flood detention areas. The pattern of conversion was very nearly the same for both periods 1956-1981 and 1981-1994.
2.5 Projections
Based on the above trend, the urban area would grow to 42,600 ha by 2000 and 53,800 ha by 2010. This constitutes 30% and 37% of the study area respectively.
A northward expansion of the core area could be expected with he development of 160 ha of land recently reclaimed I Muthuraiawela.
3. Conclusions
Apart from the dominant urban core, the urban structure in the Greater Colombo area is mainly one of ribbon development with isolated clusters of more concentrated urban areas. The rate of expansion of the urban area averaged about 5% annually, since 1956.
The pattern of urbanization since 1956, was influenced mainly by small-scale infilling of rural areas and intensification and intensification of ribbon development along main and secondary roads. The process of infill and intensification is greater in a south-easterly direction while there is greater scatter in a north-easterly direction.
The Urban Development Authority, has identified Kesbewa, Athurgiriya, Mulleriyawa and Ekala as growth centers for which plans are being prepared on a priority. If implemented, this would improve the urban structure, provided there are also better transport linkages. The towns to the north-east such as Ragama, Gampaha and Veyangoda too need t be developed on a priority, considering the present scattered development and its attendant problems. In the absence of such a strategy, the tendency for urban sprawl would be greater to the north-east where most of the lands are highlands.

Illustration 1a - Urban situation around Ratmalana in 1956

Illustration 1b - Urban situation around Ratmalana in 1981
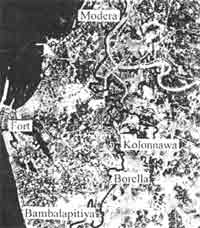
Illustration 2a - Part of the urban core around Colombo in 1956
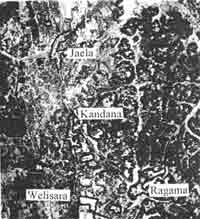
Illustration 2b - Urban clusters and ribbon development east of Muthurajawela - 1956
1.1 Background
Urban areas in Sri Lanka are declared on the basis of administrative units. However, there has been no such declaration in more than 20 years although this has been a period of considerable urban development. Further, there is no census data available after 1981, which would have provided recent information on urbanization even on the basis of administrative units.
Under these circumstances, other sources of data which help define and delineate urban areas assume greater importance. This paper analyses the trends of urbanization in the Greater Colombo area by the use of air-photos of 1956 (1:50,000), 1981 (1:40,000) and 1994 (1:20,000).
1.2 Advantage of Air-Photos
Air-photos (APs) which are now widely used as a data source in many fields have the following advantage over field surveys.
- As boundaries of urban areas do not correspond to administrative boundaries, a more accurae delineaion of urban areas is possible with APs even with scales as small as 1:50,000.
- APs provide an instant snapshot over a wide area so that with periodical coverage over the same area, they facilitate rapid assessment of trends (Illustrations 1a and 1b).
- Spatial patterns of urban growth such as the urban core, cluster, ribbon development, and sprawal can be very clearly visualized by he use of APs (Illustrations 2a and 2b)
- They are arguably cheaper than field surveys, especi-ally when the cost of AP coverage could be apportioned over a number of projects that us the data.
Considering the purpose of the study and the source of data, urban areas were defined as follows.
- A continuous block of built-up land around Colombo city which forms the urban core.
- All enclaves of non built-up land within this core.
- Apart from built-up areas, parks, playgrounds and other open amenity spaces were also defined as urban.
- Outside he core, a minimum area criterion, determined by air-photo
scale and cartographic constraints had to be used to delineate urban
areas so that in the case of the smallest scale APs (1:50,000) the
minimum delineation unit was 1 ha (ie. 2mm x 2mm).
Although it was possible to have smaller extents of area I the case of the larger scale APs (ie. 1:40,000 and 1:20,000), the above was adopted as the minimum delineation unit throughout for reasons of consistency. - At the urban fringe where built-up areas are thinly spread, an aggregation criterion was used which related the length of building with perpendicular distances separating them. Any area that was equal to or greater than the minimum delineation unit on the basis of such aggregaion of built-up area, was defined us urban.
The analysis is based primarily on the map of urbanizatin trend produced by the interpretation of APs. It deals first with the urban situation in 1956 followed by the ubanization in the periods 1956-1981 and 1981-1984.
2.1 Urban Area in 1956
The urban area in 1956 included Colombo city, Nugegoda, Dehiwela/Mt Lavinia municipal council area excluding Attidiya and pars of Moratuwa urban council area. In addition there were mainly, the satellite towns of Negombo, Gampaha, Ragama, Panadura and Kalutara.
The urban area added upto 7,200 ha in 1956 and comprised 5% of the study area which covered a major part of the Western Province. The urban core (ie: block of continues built-up area) made up 75% of the urban area reflecting the urban concentration around Colombo.
2.2 Urban from 1956-1981
During this period, the urban core area expanded upto Kerawalapitiaya (2.5 km north of Wattala) in the north, Kotikawate in the east, Navinna in the south -east and Egoda Uyana (2.5 km north of Panadura) in the south.
This increase was the result of ribbion development along Colombo-Katunayake road from Welisara to Ja-ela and again from Seeduwa to Negombo and along Galle road from Kudawaskaduwa to Katukurunda. There was growth around Kalutara town as well. In areas east and south-east of Bolombo, there was considerable ribbon development along secondary roads too.
In extent, the total urban area had grown to 21,400 ha, covering 15% of the study area. This represented a 200% increase over the 25 years, or a annual increase of 8%.
2.3 Urbanization from 1981 and 1994.
During this period the core area had expanded upto Hokandara in the east, beyond Kesbewa in the south-east and Pinwata in the south. The continuous northward expansion of the core has been constrained by the Muthurajawela marsh. The area within a 10 km radius of Colombo is almost completely urban.
In the outer areas, ribbon development was pronounced along Ja-ela-Minuwangoda road, Negombo-Minuwangoda road, Colombo-Kandy road, High Level road and Panadura -Horana road. Further there was urban expansion around Gampaha town, around Airpor at Katunayake, and around Kalutara town.
During he thirteen years upto 1994, the urban area had increased to 35,900 ha. Comprising 25% of the study area. This represented an increase of 68% over the 1981 figure and an annual increase of 5% between 1881 and 1994.
2.4 Types of Land Converted to Urban Use
North and north-east of Colombo, about 70% of the conversions to urban use were from highlands (coconut lands etc.) and the rest from village settlements.
To the east and south-east, conversion to urban use was mostly from village settlements. This explains the densified development in the south-east considering also that about 570 ha of lands in this part are declared flood detention areas. The pattern of conversion was very nearly the same for both periods 1956-1981 and 1981-1994.
2.5 Projections
Based on the above trend, the urban area would grow to 42,600 ha by 2000 and 53,800 ha by 2010. This constitutes 30% and 37% of the study area respectively.
A northward expansion of the core area could be expected with he development of 160 ha of land recently reclaimed I Muthuraiawela.
3. Conclusions
Apart from the dominant urban core, the urban structure in the Greater Colombo area is mainly one of ribbon development with isolated clusters of more concentrated urban areas. The rate of expansion of the urban area averaged about 5% annually, since 1956.
The pattern of urbanization since 1956, was influenced mainly by small-scale infilling of rural areas and intensification and intensification of ribbon development along main and secondary roads. The process of infill and intensification is greater in a south-easterly direction while there is greater scatter in a north-easterly direction.
The Urban Development Authority, has identified Kesbewa, Athurgiriya, Mulleriyawa and Ekala as growth centers for which plans are being prepared on a priority. If implemented, this would improve the urban structure, provided there are also better transport linkages. The towns to the north-east such as Ragama, Gampaha and Veyangoda too need t be developed on a priority, considering the present scattered development and its attendant problems. In the absence of such a strategy, the tendency for urban sprawl would be greater to the north-east where most of the lands are highlands.
Illustration 1a - Urban situation around Ratmalana in 1956
Illustration 1b - Urban situation around Ratmalana in 1981
Illustration 2a - Part of the urban core around Colombo in 1956
Illustration 2b - Urban clusters and ribbon development east of Muthurajawela - 1956