| GISdevelopment.net ---> AARS ---> ACRS 1996 ---> Geoscience / DTM |
DEM Accuracy Derived from
ASTER Data
Mitsuharu Tokunaga, Seiich Hara
Central Computer Services Co., Ltd.
6081-10 Kameido, Koto-ku, Tokyo 136 Japan
Voic +81-3-5626, Fax +815626-7792,
Email :toku@ccs.co.jp
Mitsuharu Tokunaga, Seiich Hara
Central Computer Services Co., Ltd.
6081-10 Kameido, Koto-ku, Tokyo 136 Japan
Voic +81-3-5626, Fax +815626-7792,
Email :toku@ccs.co.jp
Abstract
The advanced Spaceborne Thermal Emission and Reflection Radiometer (ASTER) is one of instruments boards on EOS-AM1 spacecraft, will be launched by NASA in USA on June 1998. The ASTER instrument has developed by Ministry of International Trade and Industry of Japan, based on the requirement of ASTER science team constituted with Japanese and American scientists.
DEM working group of Japan's ASTER science team defined the general specification of DEM products, and has been developing the algorithm of DEM generation. The DEM products generated by the algorithm will be distributed through ASTER ground data system (ASTER GDS) that has been development by Earth Remote Sensing Data Analysis Center (ERSDAC) of Janan, In this paper, We disclose the specification, contents and accuracy of the DEM products.
ASTER DEM products will be provided to 2 type products such as XYZ set and Z set. 'XYA set is consisted of header, relative DEM and Quality flage (correlation value, abnormal value, water and cloud area). Z set is consisted of header and the 30m grid DEM made from XYZ set and Quality flage. Relative DEM means elevation data derived from ASTER stereo pair images using data are genrated from JERS1/OPS data and DEM derived from topographic maps.
Using the simulation data, DEM are generated by stereo matching on area correlation.
As a result, the relative DEM was generated as the accuarcy of 12.5m R.M.S.E.
1. ASTER instrument
1.1 Spececraft Parameters
The Advanced Spaceborne Thermal Emission and Reflection Radiometer (ASTER) is one of instruments boarded on EOS-AM1 spacecraft, will be launched by NASA, USA on June, 1998.
The spacecraft parameters shows in table 1.
Table 1 Orbit Parameters
1.2 ASTER Instrument
the ASTER instrument was developed by Ministry of International Trade and Industry of Japan and Japan Resources Observation System Organization based on he requirements ASTER science team constituted with Japanese and American scientists.
The ASTER is consisted of three sensors such as the Visible and Near Infrared Radiometer (VNIR), The Short Wavelength Infrared Radiometer (SWIR) and Thermal Infrared Radiometer (TIR).
Table 2 ASTER Instruments Characteristic
VNIR has the following characterists for DEV generation.
We have had the following policies on DEM generation.
The general flow chart shows in figure 1 and figure 2.
![]()
Figure 1 General Flow Chart (1)
![]()
Figure 2 General Flow Chart (2)
This algorithm will be implement in ASTER Ground Data System.
3.1 Orientation Parameter
Orientation data are defined using TDRSS On-Board Navigation System (TONS) data. Therefore, knowledge of Satellite position is very well than one of ordinary satellite. The performance of EOS-AM1 shows follow.
Table 3 TONS Performance
Table 4 Pointing Accuracy at Instrument Interface
3.2 Stereo Matching Method
We adopted the stereo matching method using area correlation technique. In a search of correspondence point, We utilized stereo matching method on three stages. Because it was a purpose that process time is saved and mismatching is reduced. So, First correspondence of tie point is examined using SSDA method. Second and Third correspondence is examined using correlation method.
3.3 Cloud and Water Area Extraction
The area where might be occurred mismatching such as cloud and water will be extracted using 3 data (Visible and Near Infrared). Cloud area is extracted using threshold.
Water area extracted using threshold, variation in specific window and coarse DEM .
Abnormal elevation data is checked using calculated DEM . If land inclination calculated from neighborhood elevation data is larger than a threshold, the DEM is defined as abnormal value. Also if the elevation data is out of between the specified minimum elevation and the specified maximum elevation, the DEM is defined as abnormal value.
3.5 DEM Browse Generation
The shaded image I generated from DEM data. Then the shaded data is compressed by JPED compression.
3.6 Data Conversion
DEM generated using stereo matching method is located on every other pixels of ASTER Leavel 1Adata. It's unit is the earth fixed coordination. The Z set is converted from the earth fixed coordination to map projection such as LAT/LON, UTM, Merchator, and so on.
If GCP are available, DEM is corrected using GCP. The orientation data is not corrected, and DEM is corrected directly by bias data calculated from GCP and DEM .
4. ASTER DEM Product
Two kinds of DEM products will be distributed.
XYZ set product is the Data Set that consisted of relative elevation data, correlation value and quality flage.
The elevation is calculated by stereo matching, and tie point are corresponded with the locate of every other pixels of input image data (ASTER level 1A data)
the coordinate system is the earth fixation coordinate system. Therefore, it isn't data but random data on the earth fixation coordinate system.
The quality flags are the index data which are indicated the area where elevation was abnormal, matching impossibility area and so on.
The correlation value is also one of quality index. If correlation value is low value, probably the mismatching is occurred.
XYZ set DEM is planed to be processed 30 products per day on ASTER GDS.
4.2 Z set
Z set product consists of elevation data made from XYZ set DEM and quality flage.
Elevation data is converted grid data on map projection. Such as UTM, polarstereo, latitude longitude. When GCP exists, we can make the absolute DEM .
By using quality flags, the no-calculated DEM data is able to be interpolated from calculated DEM data of neighbor data, or converted into a fixed value. DEM provided by observation of multiple times is possible to be upgraded to high accuracy data. Also DEM mosicing is available using the continuous scene data.
5. Estimation of DEM Accuracy Using ASTER Simulation Data
The accuracy of DEM is estimated the two steps.
In first step, the estimation is carried out using simulation data. The second step, the estimation is caried out using geometric model in additonal to noise data.
5.1 ASTER Simulation Data Generation
ASTER simulation data is generated using JERS1 OPS data and DEM data derived from topographic map. In this paper, it is used that 50m grid DEM provided from Geogrpahical Survey Institute of Japan.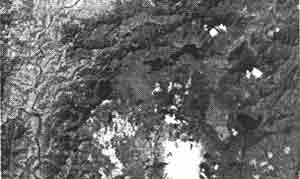
Figure 3 ASTER simulation data
5.2 Results of DEM Generation
The result of stereo matching shows in table 5 and figure 4.
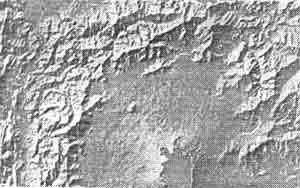
Figure 4 Shaded image of DEM derived from ASTER Simulation Data
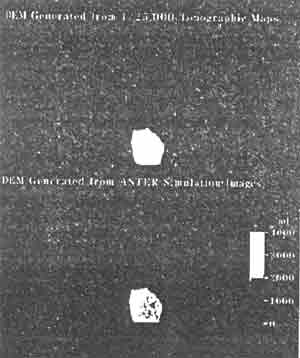
Figure 5 Shaded image of DEM derived from ASTER Simulation Data
Theoretical accuracy of DEM is defined by next equation.
Accuracy = (Ground Resolution)/(base and height ratio)* (matching) Accuracy)
In this case, if matching accuracy is one pixel, DEM accuracy is 25m. And if matching accuracy is half pixel, close to theoretical value of half pixel precision.
Table 5 Accuracy of Elevation
5.3 Estimation of DEM Accuracy
We estimated the accuracy of ASTER DEM data through ASTER simulation data were processed. When there is no error at orientation elements and stereo matching, the precision of DEM is decided by B/H and ground resolution.
As this case has no error in orientation data, the cause of error seems to be mismatching.
The orientation elements are decided by system configuration. The position knowledge of EOS-AM1 spacecraft becomes high to utilize data of TONES satellite compared with others spacecraft. Therefore orientation error is not mainly cause in elevation error.
And it is easy to be matching on stereoscopic image in along track direction, compared with one on cross track direction. Therefore the accuracy of DEM using real ASTER data will be not change one of simulation data.
5.4 The Cause of Mismatching
The area where mismatching are occurred are estimated that JERS-1 data were processed about 30 scenes include desert zone tropical rain forest zone, a grassy plain steep mountain zone. As a result, the area where mismatching are occurred had the next characteristic.
The results of experiment were able to get several characters near by a theory value, showed in the table.
On the other hand ,ASTER data has the capability that are B/H = 0.6, the ground resolution = 15 m. in case of ASTER data the accuracy of DEM is settled 12.31 it's near a theory value.
5.5 Result of Cloud and Water Area Extraction
The result of water area detection shows in figure 6. Black color area is water area. The take area is extracted. Well
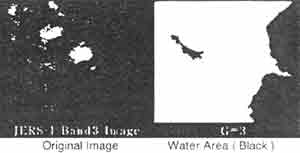
Figure 6: Extraction Water Area
Estimation DEM Accuracy using ASTER Model Data
STER geometric model is designed. After that, The DEM curacy is estimated by addition of orientation error.
Geometric parameter is used nominal ASTER orbital data.
1. Experiments Method
Orbital data error is applied for each orientation parameters such as location data (X,Y,Z) and orientation data (w,F,k). The maximum of error is applied from the orbital stability of EOS-AM1. The orbital position is added the error by 30m steps until +-150m. And orbital orientation is added on the error by 15 arcsec until- arcsec. Also error value is added is added on nadir observation and /or ackward observation.
2. Results
The results show the next tables.
Table 6 addition Error on Nadir Data
Table 7 addition Error on Backward Data
Table 8 Addition Error on nadir and Backward Data
7. Future
ASTER DEM product's accuracy will be 12.5m that has the potentiality of drawing 1:100,000 scale topographic map.
The Alogorithm will be upgradiong, especially searching method of stero tie point, extraction method of mismatching area.
8. Acknowledgment
This projects has been supported by ERSDAC of Japan. The author thanks members DEM working group of Japanese ASTER science team for his comments and advise.
9. Reference
The advanced Spaceborne Thermal Emission and Reflection Radiometer (ASTER) is one of instruments boards on EOS-AM1 spacecraft, will be launched by NASA in USA on June 1998. The ASTER instrument has developed by Ministry of International Trade and Industry of Japan, based on the requirement of ASTER science team constituted with Japanese and American scientists.
DEM working group of Japan's ASTER science team defined the general specification of DEM products, and has been developing the algorithm of DEM generation. The DEM products generated by the algorithm will be distributed through ASTER ground data system (ASTER GDS) that has been development by Earth Remote Sensing Data Analysis Center (ERSDAC) of Janan, In this paper, We disclose the specification, contents and accuracy of the DEM products.
ASTER DEM products will be provided to 2 type products such as XYZ set and Z set. 'XYA set is consisted of header, relative DEM and Quality flage (correlation value, abnormal value, water and cloud area). Z set is consisted of header and the 30m grid DEM made from XYZ set and Quality flage. Relative DEM means elevation data derived from ASTER stereo pair images using data are genrated from JERS1/OPS data and DEM derived from topographic maps.
Using the simulation data, DEM are generated by stereo matching on area correlation.
As a result, the relative DEM was generated as the accuarcy of 12.5m R.M.S.E.
1. ASTER instrument
1.1 Spececraft Parameters
The Advanced Spaceborne Thermal Emission and Reflection Radiometer (ASTER) is one of instruments boarded on EOS-AM1 spacecraft, will be launched by NASA, USA on June, 1998.
The spacecraft parameters shows in table 1.
| Orbit | Sun Synchronous |
| Cycle | 16 days |
| Period a orbit | 98.9 min. |
| Altitude | 705m (at equator) |
| Inclination | 98.2 degree |
| Orbit Position Knowledge | 150m (3s |
1.2 ASTER Instrument
the ASTER instrument was developed by Ministry of International Trade and Industry of Japan and Japan Resources Observation System Organization based on he requirements ASTER science team constituted with Japanese and American scientists.
The ASTER is consisted of three sensors such as the Visible and Near Infrared Radiometer (VNIR), The Short Wavelength Infrared Radiometer (SWIR) and Thermal Infrared Radiometer (TIR).
| VNIR | SWIR | TIR | |
| Range (mm) | Band 1 0.52-0.60 |
Band 4 1.600-1.700 |
Band 10 8.125 -8.475 |
| Band 2 0.63-0.69 |
Band 5 2.145-2.185 |
Band 11 8.475 -8.825 | |
| Band 3 N 0.76-0.86 |
Band 7 2.235-2.285 |
Band 12 8.925 -8.725 | |
| Band 8 2.295-2.365 |
Band 14 10.95-11.65 | ||
| Band 9 2.360-2.430 |
|||
| Ground Resolution | 15 m | 30m | 90m |
| Cross-track Pointing (deg.) | 24 | 8.55 | 8.55 |
| Swath Width(km) | 60 | 60 | 60 |
VNIR has the following characterists for DEV generation.
- the stereoscopic capability in the along track direction
- the stereoscopic viewers are observed are observed by nadir and backward
- Base to Height Ratio (B/H) is fixed 0.6.
- Ground resolution is approximately 15 m.
- the backward viewing detector has tilt angle on the degree from along track direction. Because the corresponding area with nadir image and backward image is made sure of maximu, by compensation for the earth rotation.
We have had the following policies on DEM generation.
- DEM are generated operationally, if it is possible.
- GCP aren't utilized with a basis.
- Coarse DEM are utilized with a basis.
- DEM of 30m grid are generated.
- DEM generation of Southeast Asia area is given high priority.
- DEM are revised to higher accuracy data using multiple observation data.
- As ASTER is optical sensor, it is impossible to generate DDDEM in cloud area, etc. Therefore, these area has to be detected automatically.
- For assure to quality of product, abnormal DEM data that caused by mismatching have to be detected automatically.
- The accuracy of elevation data depends on pointing knowledge of sparcecraft because GCP isn't utilized. Therefore, the performance of pointing knowledge had be clear.
- Coarse DEM is desired one of high accuracy. As the best DEM product is DTED made by Defense Mapping Agency of USA, it isn't available. So, next better product is GLOBE product of DCW product. As the GLOBE product is 1km Grid data, GLOBE will be selected as coarse DEM .
The general flow chart shows in figure 1 and figure 2.
Figure 1 General Flow Chart (1)
Figure 2 General Flow Chart (2)
This algorithm will be implement in ASTER Ground Data System.
3.1 Orientation Parameter
Orientation data are defined using TDRSS On-Board Navigation System (TONS) data. Therefore, knowledge of Satellite position is very well than one of ordinary satellite. The performance of EOS-AM1 shows follow.
| normal | Worst | |
| Radial Position (m) | 5 | 15 |
| Intrack Position (m) | 30 | 100 |
| X-Track Position (m) | 20 | 50 |
| X-Track Velocity (m/s) | 0.022 | 0.056 |
| Worst Case (arcsec, 3s) | Roll | Pitch | Yaw |
| Dynamic | 12.1 | 14.2 | 12.9 |
| Static | 55.6 | 56.0 | 85.1 |
3.2 Stereo Matching Method
We adopted the stereo matching method using area correlation technique. In a search of correspondence point, We utilized stereo matching method on three stages. Because it was a purpose that process time is saved and mismatching is reduced. So, First correspondence of tie point is examined using SSDA method. Second and Third correspondence is examined using correlation method.
3.3 Cloud and Water Area Extraction
The area where might be occurred mismatching such as cloud and water will be extracted using 3 data (Visible and Near Infrared). Cloud area is extracted using threshold.
Water area extracted using threshold, variation in specific window and coarse DEM .
- Land-water check are carried out using coarse DEM .
- If a coarse DEM is marked as water, calculate the variation in specific window. While variation is less than the threshold value, the area is extracted as water area.
Abnormal elevation data is checked using calculated DEM . If land inclination calculated from neighborhood elevation data is larger than a threshold, the DEM is defined as abnormal value. Also if the elevation data is out of between the specified minimum elevation and the specified maximum elevation, the DEM is defined as abnormal value.
3.5 DEM Browse Generation
The shaded image I generated from DEM data. Then the shaded data is compressed by JPED compression.
3.6 Data Conversion
DEM generated using stereo matching method is located on every other pixels of ASTER Leavel 1Adata. It's unit is the earth fixed coordination. The Z set is converted from the earth fixed coordination to map projection such as LAT/LON, UTM, Merchator, and so on.
If GCP are available, DEM is corrected using GCP. The orientation data is not corrected, and DEM is corrected directly by bias data calculated from GCP and DEM .
4. ASTER DEM Product
Two kinds of DEM products will be distributed.
- XYZ set product
- Z set product
XYZ set product is the Data Set that consisted of relative elevation data, correlation value and quality flage.
The elevation is calculated by stereo matching, and tie point are corresponded with the locate of every other pixels of input image data (ASTER level 1A data)
the coordinate system is the earth fixation coordinate system. Therefore, it isn't data but random data on the earth fixation coordinate system.
The quality flags are the index data which are indicated the area where elevation was abnormal, matching impossibility area and so on.
The correlation value is also one of quality index. If correlation value is low value, probably the mismatching is occurred.
XYZ set DEM is planed to be processed 30 products per day on ASTER GDS.
4.2 Z set
Z set product consists of elevation data made from XYZ set DEM and quality flage.
Elevation data is converted grid data on map projection. Such as UTM, polarstereo, latitude longitude. When GCP exists, we can make the absolute DEM .
By using quality flags, the no-calculated DEM data is able to be interpolated from calculated DEM data of neighbor data, or converted into a fixed value. DEM provided by observation of multiple times is possible to be upgraded to high accuracy data. Also DEM mosicing is available using the continuous scene data.
5. Estimation of DEM Accuracy Using ASTER Simulation Data
The accuracy of DEM is estimated the two steps.
In first step, the estimation is carried out using simulation data. The second step, the estimation is caried out using geometric model in additonal to noise data.
5.1 ASTER Simulation Data Generation
ASTER simulation data is generated using JERS1 OPS data and DEM data derived from topographic map. In this paper, it is used that 50m grid DEM provided from Geogrpahical Survey Institute of Japan.
- Original DEM is used to elevation data to be gnerated from : 1:2500 topographic may by Geographic Survey Institute of Japan.
- Image data is resample fromJERS1 data.
- Orientation image data is calculated from JERS1 data.
- ASTER backward image data is calculated from DEM and orthoimage data.
- nadir and backward image stereo pair data are generted.
- B/H is 0.6 on along track.
- ground resolution is approximately 15m.
- orbit data are adopt the nominal value.
Figure 3 ASTER simulation data
5.2 Results of DEM Generation
The result of stereo matching shows in table 5 and figure 4.
Figure 4 Shaded image of DEM derived from ASTER Simulation Data
Figure 5 Shaded image of DEM derived from ASTER Simulation Data
Theoretical accuracy of DEM is defined by next equation.
Accuracy = (Ground Resolution)/(base and height ratio)* (matching) Accuracy)
In this case, if matching accuracy is one pixel, DEM accuracy is 25m. And if matching accuracy is half pixel, close to theoretical value of half pixel precision.
| Positive Maximum Error (m) | Negative Maximum Error (m) | Average Error (m) | R.M.SE.(m) |
| 175 | -199 | 0.87 | 12.31 |
5.3 Estimation of DEM Accuracy
We estimated the accuracy of ASTER DEM data through ASTER simulation data were processed. When there is no error at orientation elements and stereo matching, the precision of DEM is decided by B/H and ground resolution.
As this case has no error in orientation data, the cause of error seems to be mismatching.
The orientation elements are decided by system configuration. The position knowledge of EOS-AM1 spacecraft becomes high to utilize data of TONES satellite compared with others spacecraft. Therefore orientation error is not mainly cause in elevation error.
And it is easy to be matching on stereoscopic image in along track direction, compared with one on cross track direction. Therefore the accuracy of DEM using real ASTER data will be not change one of simulation data.
5.4 The Cause of Mismatching
The area where mismatching are occurred are estimated that JERS-1 data were processed about 30 scenes include desert zone tropical rain forest zone, a grassy plain steep mountain zone. As a result, the area where mismatching are occurred had the next characteristic.
- when the same intensity level
- when resemblance pattern continues
- when saturation data exist
- when area of the sea cloud level exists
- shadow department of clouds
The results of experiment were able to get several characters near by a theory value, showed in the table.
On the other hand ,ASTER data has the capability that are B/H = 0.6, the ground resolution = 15 m. in case of ASTER data the accuracy of DEM is settled 12.31 it's near a theory value.
5.5 Result of Cloud and Water Area Extraction
The result of water area detection shows in figure 6. Black color area is water area. The take area is extracted. Well
Figure 6: Extraction Water Area
Estimation DEM Accuracy using ASTER Model Data
STER geometric model is designed. After that, The DEM curacy is estimated by addition of orientation error.
Geometric parameter is used nominal ASTER orbital data.
1. Experiments Method
Orbital data error is applied for each orientation parameters such as location data (X,Y,Z) and orientation data (w,F,k). The maximum of error is applied from the orbital stability of EOS-AM1. The orbital position is added the error by 30m steps until +-150m. And orbital orientation is added on the error by 15 arcsec until- arcsec. Also error value is added is added on nadir observation and /or ackward observation.
2. Results
The results show the next tables.
| Along Track (m) | Cross Track (m) | Elevation (m) | |
| X axis (-150m) | -134.73 | 11.55 | -223.86 |
| Y axis (+150m) | 134.74 | -11.55 | 223.88 |
| X axis (-150m) | 3.91 | -68.05 | 15.42 |
| Y axis (+150m) | -3.91 | 68.05 | -15.42 |
| Z axis (-150m) | -0.22 | 3.25 | -0.81 |
| Z axis (+150m) | 0.22 | -3.25 | 36.05 |
| Roll (-90arcsec) | 9.14 | -156.92 | -35.17 |
| Roll (+90arcsec) | -8.91 | 156.89 | 35.17 |
| Ritch (+90arcsec) | 310.03 | -26.58 | 515.26 |
| Ritch (-90arcsec) | -310.48 | 26.52 | -515.26 |
| Yaw (-90arcsec) | -13.55 | -0.91 | -22.50 |
| Yaw (+90arcsec) | 13.55 | 0.91 | 22.49 |
| Along Track (m) | Cross Track (m) | Elevation (m) | |
| X axis (-150m) | -0.21 | 11.25 | 223.86 |
| Y axis (+150m) | 0.21 | -11.25 | -223.88 |
| X axis (-150m) | -3.91 | -67.80 | -15.53 |
| Y axis (+150m) | 3.90 | 67.80 | +15.53 |
| Z axis (-150m) | 0.19 | 2.35 | -135.28 |
| Z axis (+150m) | -0.19 | -.2.35 | 135.28 |
| Roll (-90arcsec) | -9.06 | -158.79 | -42.23 |
| Roll (+90arcsec) | 9.30 | 158.80 | 43.13 |
| Ritch (-90arcsec) | 0.69 | 29.27 | -691.15 |
| Ritch (+90arcsec) | -0.69 | -29.22 | 690.15 |
| Yaw (-90arcsec) | 4.85 | 83.49 | 26.51 |
| Yaw (+90arcsec) | 4.79 | -83.49 | -26.43 |
| Along Track (m) | Cross Track (m) | Elevation (m) | |
| X axis (-150m) | -134.93 | 0.30 | 0.10 |
| Y axis (+150m) | 134.93 | -0.31 | -.11.88 |
| X axis (-150m) | -0.01 | -134.83 | 0.95 |
| Y axis (+150m) | -0.01 | 134.82 | 0.96 |
| Z axis (-150m) | 0.04 | 0.90 | -134.82 |
| Z axis (+150m) | -0.04 | -313.39 | 134.82 |
| Roll (-90arcsec) | -0.15 | 313.87 | -17.87 |
| Roll (+90arcsec) | 0.16 | -3.79 | 17.99 |
| Ritch (-90arcsec) | 311.02 | 3.79 | -174.88 |
| Ritch (+90arcsec) | -310.87 | 82.67 | 175.15 |
| Yaw (-90arcsec) | 15.42 | -82.66 | 4.02 |
| Yaw (+90arcsec) | 15.36 | -82.66 | -3.93 |
7. Future
ASTER DEM product's accuracy will be 12.5m that has the potentiality of drawing 1:100,000 scale topographic map.
The Alogorithm will be upgradiong, especially searching method of stero tie point, extraction method of mismatching area.
8. Acknowledgment
This projects has been supported by ERSDAC of Japan. The author thanks members DEM working group of Japanese ASTER science team for his comments and advise.
9. Reference
- ERSDAC, 1995 Algorthm theorithm Basis Document for ASTER Level-1 data Processing.
- KUDVA, EOS-AMI Pointing performance spacecraft instrument interface, ASTER science team meeting in pasadena, 1996.
- KUDVA, TONS performance, ASTER, Science Team Meting in Pasadena, 1996.
- neeck, pointing stability performance, ASTER Science Team meeting in Pasadena, 1996.
- Tokunaga, Overview of DEM Product Generated by Using ASTER Data, ISPRS Archives XXXI B4,1996.