| GISdevelopment.net ---> AARS ---> ACRS 1996 ---> Geoscience / DTM |
A Study of DEM Accuracy
according to Spatial Resolution
Masataka Tankagi
Institute of Industrial Science,
The University of Tokyo.
7-22, Roppongi, Minato-ku, Tokyo 106, Japan
Tel. +81-3-302-6231
Fax. +81-3-3479-2762
E-mail: mailto:mural1@shunji.iis.u-tokyo.ac.jp
Web : http://www.shiba.iis.u-tokyo.ac.jp/takagi
Masataka Tankagi
Institute of Industrial Science,
The University of Tokyo.
7-22, Roppongi, Minato-ku, Tokyo 106, Japan
Tel. +81-3-302-6231
Fax. +81-3-3479-2762
E-mail: mailto:mural1@shunji.iis.u-tokyo.ac.jp
Web : http://www.shiba.iis.u-tokyo.ac.jp/takagi
Abstract
Digital Elevation Model (DEM) is indicpensable for many analysis such as topographic feature extraction, runoff analysis, slope stability analysis, landscape analysis and so on. Such analysis require a high accurate DEM. The accuracy of DEM is usually represented by spatial resolution and heigh accuracy. The height accuracy according to DEM generation emthod was evauated lays year in this s tudy, DEM accuracy according to spatial resolution was evaluated.
DEMs of various resolution(100m, 150m, 200m grid size) were prepared for an evaluation. Each analysis was carried out using previous DEMs. A differences of the results according to spatial resolution were concluded. The results showed spatial resolution influenced an inclination very well. Almost terrain analyses use comination of slope aspect and inclination. So, we must take care to use low resolution DEM. On the other hand, nearest neighbor showed the best method as resampling method. Mean value resampling orminimum value resampling made flat complicated terrain surface. So, nearest neighbor resapling should be used when low resolution DEM must be gerated.
1.Introduction
There are many kinds of DEM (Digital Elevation Model) generation methods such as a sereo matching from aerial photgraphor satellite image, an interferemetry from SAR and an interpolation of topographic maps. Some commercial computer software support such DEM generation fuction. On the other hand, we can use an accomplished DEM. For example, NGDC, NOAA offers global land one-km base elevation (GLOBE). And USGS Digital Chart of the World that has elevation information also. Nowadays, we have many analyses such as topographic feature extraction, runoff analysis such as topographic feature extraction , runoff analysis, slope stability analysis, landscape analysis and son on. We must consider which accuracy is appropriate for any analyses. Therefore, A study of DEM accuracy is very important.
By the way, we developed a new controur line interpolation method for DEM generation last year [1]. The method which is based on buffering showed higher performance rather than existing interpolation methods. However an accuracy of DEM was depending upon contour line interval. A high density controur line information was required for a high accurate DEM. If a percentage of total pixel number which consisted contour line indicates less 30%, a correct percentage by comparions with original DEM indicates less than 50%. Therefore, an important of contour line interval was reconginzed in DEM generation.
In previous study, an accuracy of DEM incase of fixed spatial resolution was evaluated. In this study, an accuracy of DEM according to spatial resolution will be evaluated. We prepared a various grid size of DEMs. The DEMs will be used for topographical analysis, slope stability analysis and runoff analysis. After, that, results of each analysis will be compared with result from original DEM. A relationship between spatial resolution and DEM accuracy will be concluded.
2.2 Materials
An original DEM was generated by interpolation from 1:25000 contour maps. Its grid size is 50 m. Figure 1 shows a shaded image of the original DEM. The test area is mountainous area. So, slope stability analysis or runoff analysis can be carried out.
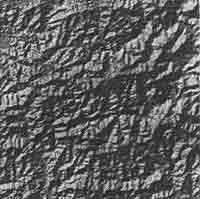
Figure 1 Shaded Image of Original DEM
For evaluation of spatial resolution, a various size DEM was prepared from the original DEM. In this study, 100m, 150m, 200m and 250m grid size DEMs were generated by resampling. There are some kinds of resapling method such as nearest neighbor, bi-linear, cubic convolution and so on. In case of DEM generation, nearest neighbor, mean and minimum value are used as resampling usually. For example, GLOBE supports maximum value, mean value and minimum value. We must consider which sampling method is the best for any analysis. So, all resampling methods were carried out to prepared materials.
3.Evaluations of DEM accuracy
3.1Slope Aspect Accuracy
A slope aspect can be expressed from DEM, which is one of the most important items for topographical analysis. In this study, the slope aspect means a direction along the maximum slope inclination at one target pixel. Figure 2 shows histogram of difference between original aspect data and resampled aspect data of each grid size. The histograms show symmetrical form. Figure 3 shows a relatiohship between grid size and percentage of correct pixels. The correct percentage in every resampling method has tendency to drop with grid size increase. Maximum value sampling showed the highest accuracy, minimum value sampling showed the worst accuracy.
Figure 2 Accuracy of Slope Aspect according to Spatial Resolution
Figure 3 Accuracy of Slope Aspect according to Spatial Resolution
3.2. Slope inclination Accuracy
A slope inclination can be expressed from DEM, which is also one of the most important items for topographical analysis. In this study, the inclination means maximum slope inclination at one target pixel. Figure 4 shows histogram of difference between original inclination data and resampled inclination data of each grid size. The histograms show asymmetrical form that is shifted to right. It means the resampled inclination data became gentle slope. Because, detailed terrain is gnarred by grid size incrase. Figure 5 shows a relationship between grid size and percentages of correct pixels. In case of slope in clinat in, correct pixel means difference with original data indicates inside of 20 degree. The nearest neighbor sampling almost showed the highest accuracy, mean value sampling showed the worst accuracy.
Figure 4 Accuracy of Slope Inclination according to Spatial Resolution
Figure 5 Accuracy of Slope Inclination according to Spatial Resolution
3.2 Slope Stability Accuracy
A slope stability analysis is popular application of DEM. Sometime we generate land slide risk map or slope failure risk map from DEM. The slope stability which means safety factor was calculated by a ratio between driving moment and residtance moment along the target profile. When the safety factor is calculated on every pixel, such risk map can be generated. Fellenius method as slope stability analysis was selected in this study. In this method, landslide type is assumed rotational slip (Figure 60a). A landslide soil is divided into some slices in order to calculate moment along the critical circle (Figure 6-b). The driving moment (T) and resistance moment (N) on each slice are calculated by the following equation.
Figure 6-a Illustration of Fellenius Method and Figure 6-b Illustration of Each Slice
T= R W. sin a N = R(C.L. + tanf. W. cos a)
R Radius of Critical Surface I(m)
C cohesion (t/m2)
f Angle of Shearing Resistance (degree)
W Weight of Each Slice (t/m) (W=Yt A)
Yt Wet Unit Weight of Soil (t/m3)
A Area of Slice (m2)
a Angle between Horizontal Axis and the Base of Slice (degree)
L Length of the Base of Slice (m)
Therefore safety factor (Fs) is calculated by the following equation.
Originally, parameters of soil mechanics (C, f, Yt) and radius of critical surface ® should be determined by experimental data and field survey data on each pixel. In this study, those parameters were given constant value as follows:
R = 200m, C = 2.0t/m2, f=10°,
Yt = 1.91/ m3
When profile at target pixel was drawn along the steepest direction, other parameters can be estimated by DEM. If this safely factor calculation applied every pixel, slope stability risk can be mapped.
Figure 7 shows histogram of difference between original sope stability data and resampled slope stability data of each grid size. The histograms show asymmetrical from that is shifted to left. It means the resampled safety factor. This situation will make serious problem because of under estimation. Figure 8 shows a relationship between grid size and percentages of correct pixels. In case of slope stability, correct pixel means difference with original data indicates inside of 0.2 (Fs). The nearest accuracy. However, each trend was very similar.
Figure 7 Accuracy of Safety Factor according to Spatial Resolution
Figure 8 Accuracy of Safety Factor according to Spatial Resolution
3.2 Drainage Pattern Accuracy
A runoff analysis or a drainage pattern generation is very popular application of DEM. Usually, such analysis can be carried out by using a grid series tank model . A precipitation is supplied to each DEM grid that is one of the tanks. An inlet content which means effective rainfall ofr dischargeis calculated by following equation.
Qin KiRL2
Qin : Inlet Conent (m3)
Ki: Infiltration
R: Precipiation (m)
L: Grid Size (m)
The inlet contest must discharge to next grid according to slope aspect and velocity. That is to say flow tracking. The slope aspect can be calculated from DEM, the velocity can be estimated from slope inclimnation which is also calculated from DEM. And the flow in the grid can be expressed by a continuous equation as follows;
Qt+Dt = (åqin-qout)Dt
Q: Remaining Content (m3)
qin: Inlet (m3/s)
qout: Qutlet (m3/s)
Dt: Time (s)
By using previous equations, drainage pattern can be drawn. In this study, a parameetr of infiltration was given, 1.0, because purpose is just DEM evaluation.
Figure 9 shows histogram of difference between original runoff data and resampled runoff data os each grid size. The histograms show symmetrical form. Figure 10 shows a relationship between grid size and percentages of correct pixels. In case of runoff analysis, correct pixel means difference with original data I indicates inside of 20m3/s. the nearest neighbor sampling showed the highest accuracy, minimum value sampling showed the worst accuracy. The accuracy of runoff analysis indicates higher than slope stability analysis.
Figure 9 Accuracy of Drainage Pattern according to Spatial Resolution
Figure 10 Accuracy of Drainage Pattern according to Spatial Resolution
4.Conclusions
In this study, an accuracy of DEM according to spatial resolution was considered. Spatial resolution didn't influence a slope aspect very well. A slope aspect is not sensitive on spatial resolution surface generally undulate in even one pixel, so that such detailed retrain is neglected by resampling. This situation also influence slope stability analysis. The result showed under estimation in case of low resolution data. The inclination is one of the most important factor in a slope stability analysis. And almost terrain analyses use combination of slope aspect and inclination. So, we must take care to use low resolution DEM.
We tried to compare with each resamplign method. In those resampling method, nearest neighbor resampling showed the best method except slope aspect. Minimum value resampling showed the worst. Test area was selected from mountainous area. Minimum value makes flat, so that is was much different from original data.
In this study, the highest used resolution is 50m grid DEM. However, we will use less than 10m grid by commercial very high resolution satellite. In future, such very high resolution DEM must be evaluated. A spatial resolution was very important for any analysis.
References
Digital Elevation Model (DEM) is indicpensable for many analysis such as topographic feature extraction, runoff analysis, slope stability analysis, landscape analysis and so on. Such analysis require a high accurate DEM. The accuracy of DEM is usually represented by spatial resolution and heigh accuracy. The height accuracy according to DEM generation emthod was evauated lays year in this s tudy, DEM accuracy according to spatial resolution was evaluated.
DEMs of various resolution(100m, 150m, 200m grid size) were prepared for an evaluation. Each analysis was carried out using previous DEMs. A differences of the results according to spatial resolution were concluded. The results showed spatial resolution influenced an inclination very well. Almost terrain analyses use comination of slope aspect and inclination. So, we must take care to use low resolution DEM. On the other hand, nearest neighbor showed the best method as resampling method. Mean value resampling orminimum value resampling made flat complicated terrain surface. So, nearest neighbor resapling should be used when low resolution DEM must be gerated.
1.Introduction
There are many kinds of DEM (Digital Elevation Model) generation methods such as a sereo matching from aerial photgraphor satellite image, an interferemetry from SAR and an interpolation of topographic maps. Some commercial computer software support such DEM generation fuction. On the other hand, we can use an accomplished DEM. For example, NGDC, NOAA offers global land one-km base elevation (GLOBE). And USGS Digital Chart of the World that has elevation information also. Nowadays, we have many analyses such as topographic feature extraction, runoff analysis such as topographic feature extraction , runoff analysis, slope stability analysis, landscape analysis and son on. We must consider which accuracy is appropriate for any analyses. Therefore, A study of DEM accuracy is very important.
By the way, we developed a new controur line interpolation method for DEM generation last year [1]. The method which is based on buffering showed higher performance rather than existing interpolation methods. However an accuracy of DEM was depending upon contour line interval. A high density controur line information was required for a high accurate DEM. If a percentage of total pixel number which consisted contour line indicates less 30%, a correct percentage by comparions with original DEM indicates less than 50%. Therefore, an important of contour line interval was reconginzed in DEM generation.
In previous study, an accuracy of DEM incase of fixed spatial resolution was evaluated. In this study, an accuracy of DEM according to spatial resolution will be evaluated. We prepared a various grid size of DEMs. The DEMs will be used for topographical analysis, slope stability analysis and runoff analysis. After, that, results of each analysis will be compared with result from original DEM. A relationship between spatial resolution and DEM accuracy will be concluded.
2.2 Materials
An original DEM was generated by interpolation from 1:25000 contour maps. Its grid size is 50 m. Figure 1 shows a shaded image of the original DEM. The test area is mountainous area. So, slope stability analysis or runoff analysis can be carried out.
Figure 1 Shaded Image of Original DEM
For evaluation of spatial resolution, a various size DEM was prepared from the original DEM. In this study, 100m, 150m, 200m and 250m grid size DEMs were generated by resampling. There are some kinds of resapling method such as nearest neighbor, bi-linear, cubic convolution and so on. In case of DEM generation, nearest neighbor, mean and minimum value are used as resampling usually. For example, GLOBE supports maximum value, mean value and minimum value. We must consider which sampling method is the best for any analysis. So, all resampling methods were carried out to prepared materials.
3.Evaluations of DEM accuracy
3.1Slope Aspect Accuracy
A slope aspect can be expressed from DEM, which is one of the most important items for topographical analysis. In this study, the slope aspect means a direction along the maximum slope inclination at one target pixel. Figure 2 shows histogram of difference between original aspect data and resampled aspect data of each grid size. The histograms show symmetrical form. Figure 3 shows a relatiohship between grid size and percentage of correct pixels. The correct percentage in every resampling method has tendency to drop with grid size increase. Maximum value sampling showed the highest accuracy, minimum value sampling showed the worst accuracy.
Figure 2 Accuracy of Slope Aspect according to Spatial Resolution
Figure 3 Accuracy of Slope Aspect according to Spatial Resolution
3.2. Slope inclination Accuracy
A slope inclination can be expressed from DEM, which is also one of the most important items for topographical analysis. In this study, the inclination means maximum slope inclination at one target pixel. Figure 4 shows histogram of difference between original inclination data and resampled inclination data of each grid size. The histograms show asymmetrical form that is shifted to right. It means the resampled inclination data became gentle slope. Because, detailed terrain is gnarred by grid size incrase. Figure 5 shows a relationship between grid size and percentages of correct pixels. In case of slope in clinat in, correct pixel means difference with original data indicates inside of 20 degree. The nearest neighbor sampling almost showed the highest accuracy, mean value sampling showed the worst accuracy.
Figure 4 Accuracy of Slope Inclination according to Spatial Resolution
Figure 5 Accuracy of Slope Inclination according to Spatial Resolution
3.2 Slope Stability Accuracy
A slope stability analysis is popular application of DEM. Sometime we generate land slide risk map or slope failure risk map from DEM. The slope stability which means safety factor was calculated by a ratio between driving moment and residtance moment along the target profile. When the safety factor is calculated on every pixel, such risk map can be generated. Fellenius method as slope stability analysis was selected in this study. In this method, landslide type is assumed rotational slip (Figure 60a). A landslide soil is divided into some slices in order to calculate moment along the critical circle (Figure 6-b). The driving moment (T) and resistance moment (N) on each slice are calculated by the following equation.
Figure 6-a Illustration of Fellenius Method and Figure 6-b Illustration of Each Slice
R Radius of Critical Surface I(m)
C cohesion (t/m2)
f Angle of Shearing Resistance (degree)
W Weight of Each Slice (t/m) (W=Yt A)
Yt Wet Unit Weight of Soil (t/m3)
A Area of Slice (m2)
a Angle between Horizontal Axis and the Base of Slice (degree)
L Length of the Base of Slice (m)
Therefore safety factor (Fs) is calculated by the following equation.
| Fs = | åN ------------- åT |
Originally, parameters of soil mechanics (C, f, Yt) and radius of critical surface ® should be determined by experimental data and field survey data on each pixel. In this study, those parameters were given constant value as follows:
When profile at target pixel was drawn along the steepest direction, other parameters can be estimated by DEM. If this safely factor calculation applied every pixel, slope stability risk can be mapped.
Figure 7 shows histogram of difference between original sope stability data and resampled slope stability data of each grid size. The histograms show asymmetrical from that is shifted to left. It means the resampled safety factor. This situation will make serious problem because of under estimation. Figure 8 shows a relationship between grid size and percentages of correct pixels. In case of slope stability, correct pixel means difference with original data indicates inside of 0.2 (Fs). The nearest accuracy. However, each trend was very similar.
Figure 7 Accuracy of Safety Factor according to Spatial Resolution
Figure 8 Accuracy of Safety Factor according to Spatial Resolution
3.2 Drainage Pattern Accuracy
A runoff analysis or a drainage pattern generation is very popular application of DEM. Usually, such analysis can be carried out by using a grid series tank model . A precipitation is supplied to each DEM grid that is one of the tanks. An inlet content which means effective rainfall ofr dischargeis calculated by following equation.
Qin : Inlet Conent (m3)
Ki: Infiltration
R: Precipiation (m)
L: Grid Size (m)
The inlet contest must discharge to next grid according to slope aspect and velocity. That is to say flow tracking. The slope aspect can be calculated from DEM, the velocity can be estimated from slope inclimnation which is also calculated from DEM. And the flow in the grid can be expressed by a continuous equation as follows;
Q: Remaining Content (m3)
qin: Inlet (m3/s)
qout: Qutlet (m3/s)
Dt: Time (s)
By using previous equations, drainage pattern can be drawn. In this study, a parameetr of infiltration was given, 1.0, because purpose is just DEM evaluation.
Figure 9 shows histogram of difference between original runoff data and resampled runoff data os each grid size. The histograms show symmetrical form. Figure 10 shows a relationship between grid size and percentages of correct pixels. In case of runoff analysis, correct pixel means difference with original data I indicates inside of 20m3/s. the nearest neighbor sampling showed the highest accuracy, minimum value sampling showed the worst accuracy. The accuracy of runoff analysis indicates higher than slope stability analysis.
Figure 9 Accuracy of Drainage Pattern according to Spatial Resolution
Figure 10 Accuracy of Drainage Pattern according to Spatial Resolution
4.Conclusions
In this study, an accuracy of DEM according to spatial resolution was considered. Spatial resolution didn't influence a slope aspect very well. A slope aspect is not sensitive on spatial resolution surface generally undulate in even one pixel, so that such detailed retrain is neglected by resampling. This situation also influence slope stability analysis. The result showed under estimation in case of low resolution data. The inclination is one of the most important factor in a slope stability analysis. And almost terrain analyses use combination of slope aspect and inclination. So, we must take care to use low resolution DEM.
We tried to compare with each resamplign method. In those resampling method, nearest neighbor resampling showed the best method except slope aspect. Minimum value resampling showed the worst. Test area was selected from mountainous area. Minimum value makes flat, so that is was much different from original data.
In this study, the highest used resolution is 50m grid DEM. However, we will use less than 10m grid by commercial very high resolution satellite. In future, such very high resolution DEM must be evaluated. A spatial resolution was very important for any analysis.
References
- Masataka Takagi and Ryosuke Shibasaki, 1995, "Contour Line Interpolation by using Buffering Method", Proceedings of the 15h Asian Conference on Remotage Sensing, Nakhon Ratchasima, Thailand, pp WS -3-1-WS-3-5.
- Sukit Viseshsin and Shunji Murai (1990), "Automated Height Information Extraction from Eisting topographic Map", International Archives of Photogrammetry and Remote Sensign, Vol. 28 Part 4, pp.338-346.
- Kiyonari Fukue, Yousuke Kuroda, Harushisa Shimoda and Toshibumi Sakata (1990), "Simple DEM Generation Method from a Contour Image", International Archives of Photogrammetry and Remote Sensing, Vol. 28 Part 4, pp.347-355.
- F. Ackermann (1994), "Digital Elevation Models - Techniques and Application, Quality Standards, Development", International Archives of Photogrammetry and Remote Sensing, Vol. 30 Part 4, 421-432.
- G .Aumann and H. Ebner (1990), "Generation of High Fidelity Digital Terrain Models from Contours", International Archives of Photogrammetry and Remote Sensing, Vol. 29 Part 4, pp. 980-985.
- M. Takagi, S.Murai and T. Akiyama, 1992, "Generation of Land Disaster Risk Map from LANDSAT TM and DTM Data" , International Archives of Photogrammetry and Remote Sensing, Vol. 29 Commission VII, pp 754-759.