| GISdevelopment.net ---> AARS ---> ACRS 1996 ---> Forestry / Vegetation |
Mapping Tropical Forest Cover
Types using Optical Satellite Data And GIS In Gentral in Central Sumatra,
Indonesia
Yousif Ali Hussin John S.
Mwantdha Hamid Marwat
International Institute for Aerospace Survey
and Earth Science (ITC)
7500 AA Enschede, The Netherlands
Fax : (31) (53) 4874-399
E-mail: HUSSIN@ITC.NL
AbstractInternational Institute for Aerospace Survey
and Earth Science (ITC)
7500 AA Enschede, The Netherlands
Fax : (31) (53) 4874-399
E-mail: HUSSIN@ITC.NL
Never before in the history of mankind, tree and forests have assumed that global importance which is evident today. For many years the problems of deforestation in the tropical forest had raised considerable international interest. From 1850-80 about 15% of the earth's forest cover disappeared as a result of human activities (World Resources Institute 87), according to this report the tropical rain forest of Asia, Africa, and South America declined by 27 percent. This depletion is very significant, where about 2.5 million people depend n natural forest resources for many economic and environmental goods and services. According to the Food and Agriculture Organization of the United Nation report of 88, between 80 and 85 the estimated annual rate of tropical forest degradation was 0.6 percent or 11.4 million hectares. the major causes of this degradation in the tropics are causes is the population growth. In general, high population pressure has its impacts on the changes, especially in tropical countries in heavily populated areas, it is essential to monitor information is essential. The demand for timely and accurate geographic information has forest conditions. Geographic information can be derived easily from the remotely sensed Landsat Thematic Mapper ™, SPOT Panchromatic and MSS, AVHRR NOAA, radar etc. The main objective of this research was to map tropical forest cover types using optical satellite data i.e., Landsat TM and Spot XS satellite images in an Indonesian test site of Jambi Provice, Central Sumatta.
1. Introduction
FAO estimates that the forest area in the world was about 3.4 billion hectares in 1992. This area is known to be decreasing at a rate of 2.1% per year calculating from the 1962 figures. The reduction in area is however not the same everywhere. Developing countries in Latin America, Asia and Africa have higher deforestation rate than 2.1% while in the European Union, an increase in area up to 20% has been recorded between 1961 and 1992.
The fact that the forest area is decreasing worldwide is an indicator of its importance. Unfortunately most of the benefits of a forest are of destructive nature to its. Some of these benefits are the provision of wood (timber and poles) and wood products, food, fodder, medicine and fuel. Others benefits include employment, recreation, carbon dioxide sinks, wildlife habitats, genetic reservoirs and maintaining biodiversity (Buschbacher, 1986; de Gier, 1995; Hamilton, 1984).
A lot of effort, is being exerted to try and conserve the remaining forests and even create others. This has been a result of concern about the disastrous effects of deforestation. Buschbacher, (1986), summarizes these as permanent degradation of forest, loss of cultural and biotic diversity and especially in the developing nation, should of course not be forgotten.
1.1 The Indonesian Situation
In Indonesia about 75% (143 million hectares) of land surface has the status of forest land. The National Land Use Law of 1992 has designated 34% of this land as Protected forest, 45% as Production forest and 21% as Conversion forest (Hoekman, 1995). The planning, management and surveillance of such vast areas requires up-to-date information on land cover and land cover change. An accurate assessment of forest and land cover change is a prerequisite, not only for studies on climate and global environmental change, but more importantly for formulation and identification of ways to slow down, or even, half the rate of deforestation.
Several methods of acquisition, processing and analysis of various of data to monitor cover change are currently in use in Indonesia. Most methods involve use of aerial photographs and Landsat and SPOT satellite data. These have a great limitation with respect to cloud cover and haze in as far as provision of information on a regular basis is concerned. Central Sumatra, where Jambi is located, is one of those areas most affected by severe cloud cover. A study is presently under way to evaluate the usefulness of radar data (both aircraft and satellite) for forest monitoring and management especially to take advantage of its cloud and haze penetration properties. Whatever land cover classification system using these data is necessary. All data acquisition and handling techniques have some limitations. These limitations are not the same for all data. In the case of Landsat and SPOT XS (multispectral) data integration may enable the exploitation of the different information content and advantages forest cover changes. It may also improve the certainly with which predictions of the effects of different management options can be made to slow down forest degradation and deforestation.
To accurately detect and monitor forest cover types and changes, proper data collection and processing is a prerequisite. With the current advances in satellite data collection and image processing, there is a growing concern as to which data to use for what purpose and after what kind of processing. Furthermore, if a given data set is used, with what confidence can one say, that conclusions drawn from such an analysis are correct? This is particularly important for forest management in the tropics, such as in Indonesia, where the majority of the world's species are found.
Several data problem have been identified in Indonesia. Apart from problems related to satellite data acquisition such as cloud cover, the reliability of such data for classification and therefore monitoring of forest land has not been investigated. At the same time no image processing guidelines are in place to help in dealing with the huge amount of digital data available. Apart from the foregoing, the following issues call for further investigation in the use of optical satellite data in the classification of tropical rain forests. A lot of satellite data are being produced for almost all parts of the world for various uses. Some of these data are currently being used in Indonesia in the field of forestry. There is still a need to know which data is appropriate for forest cover type classification and what limitations, if any, there are, in the use such data.
As in other parts of Indonesia, there is a general trend towards an increase in human population in the Jambi area due to both to birth (in the area) and transmigration from more densely populated areas. The increase in population leads to pressures on the land for settlement, agriculture and recreation, among other. Most of this pressure is being exerted on forest land, resulting in the illegal encroachment for establishment of cropland, provision of timber and other wood products decisions to be made about how they should be managed, relevant and accurate data about the forest and its surrounding must be available, only then can the needs of the population be met and conservation for posterity be possible.
Several logging concession have been signed between the Ministry of Forest and various logging companies (Pantimena, 1996). Knowledge of how much is cut, the rate of regeneration, what forest classes are available and other related information are important for management planning. Whereas most of this information can be obtained from the normal state-of-the-art forest survey methods and that have greater temporal resolution and expensive and often unreliable after some time. Data collection methods more desirable. Though satellite data promise to meet this requirement, a problem arises as to how forest do not only depend on the activities themselves but are also known to change with time and with changes in environmental conditions. Constant monitoring of both the activities and forest cover changes is therefore a necessity. This could then help in determining the cause and effect relationships between human activities and forest degradation and designing of appropriate measure to handle them.
Tropical rain forests vary considerably (in species composition, size of stems, basal area, crown cover) form place to place, even within the same forest type. Furthermore, transition from one type to another does not often have a clear-cut boundary. These variations make classification complicated. In this regard, an assessment of classification accuracy should take into consideration the effect of variability. This would be inline with Lowell (1994) who suggested the creation of forest maps in which not all boundaries are definite and fixed, but where some are just transition zones. An investigation of these alternatives for use in classification of forest types, especially while using remotely sensed data, needs to be done.
The relationship of man and natural resources is complex, dynamic and intricate. Consequently, not all problems of a resource can be addressed in single research. The objectives of this study were: to compare and contrast the effect of spectral resolution difference of TM and SPOT XS data on the detection and classification of forest cover types; to assess the suitability of selected image transformations (vegetation index, normalized difference vegetation index, tasseled cap transformation and principal component analysis), of Landsat TM and SPOT data to improve forest cover type classification; to investigation the potential of using the fuzzy set approach to determine the accuracy of forest type classification.
2. Study area
2.1 Location and Climate
The study area lies between lines of latitude 1° 15' and 1°45' south and lines of longitude 102° 45' east. It is located in Bungotebo country, in the northwestern part of Jambi, Sumatra island, Indonesia. The Batang Hari river is a dominant feature in this area (Pantimena, 196). Other rivers in order of size are Batang Tabir, Batang Tebo, Sungai Sumai and Sungai Ajai.Muratebo found at the point where river Batang Tebo joins river Batang Hari is the main town in the study area. The area is relatively flat ranging between 5 and 30 m above sea level in most parts. The climate is hot and et most of the year, classified as group 1a. The mean annual rainfall received in the area is about 2500 mm, most of which is between is between November and May. Temperature are highest in the period of July to September (33° to 37° C). Minimum temperature are recorded at 20° to 22° C, though they sometimes drop to as low as 18° C during the months of December and January.
2.2 Forest Resource
Several methods of classification of forest land exist in Indonesia. One of these, the Consensus on Forest Land Use classification, locally known as Tata Guna Hutan Kesepakatan (TGHK), is mainly based on susceptibility to soil erosion. Using the system, forest classification in Indonesia falls in 5 broad categories according to their main function. These are : nature reserve, protection forest, other uses such as agricultural settlement (transmigration) (Weir and Djajono, 1994).
The land cover in the study area, like in most of Indonesia, is dominated by forest. The major forest types found in the study area as classified by the TGHK system are production forest, conversion forest, protection forest and other forest. Other forest land includes unproductive dry land, agriculture fields and estates.
3. Material and Methods
3.1 Data Used
In this study, the major data sources were maps and satellite image data. The maps were used in this study : Land use map of Kabupaten Bungotebo (scale 1:200 000), Forest vegetation and land use map (land cover map) of Muara (scale 1:250 000), TGHK map of Kabupaten Bungo Tebo (scale 1:250 000), Land system (land suitability map) of Bungo Tebo (scale 1:200 000), Transmigration and agriculture development area map of Kabupaten Bungo Tebo (scale 1:200 000), Agroclimatic zone map of Kabupaten Bungo Tebo (scale 1:200 000), Soil type map of Kabupaten Bungo Tebo (scale 1:200 000) Topographic maps of Lubuk Punggai, Muara Ketato, Muara Killis, Muara Tebo of scales 1:50 000 and of Muara Bungo of scale 1:250 000. The satellite image were used: Landsat TM of 15th September 1993 and Spot XS of 5th September 1994.
3.2 Methodology
The methodology used in this research is explained in Figure 1.
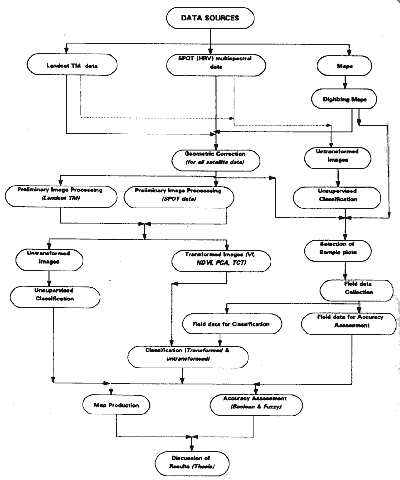
Figure 1 The General research methodology
3.2.1 Pre-field Work and field work activities
The activities were achieved before going to the field work were : geometric correction, image enhancement, visual interpretation, unsupervised classification and selection of sample plots. To help in determining the different forest types in the study area, ground truth data collection was done during the field work period. These data reflects the characteristics of different forest types (conversion forest, production forest, protection forest and other forest), especially those affecting their spectral characteristics.
3.2.2 Data processing
Classification was carried out based on the assumption that different feature type manifest different combinations of digital number (DNs) based on their inherent spectral reflectance and remittance properties. Using data collected from the field, and that already available, supervised classification was carried out for the selected pre-processed and merged images/data. The maximum likelihood algorithm was used.
4. Result
Because the authors just came back from the field work and still running the analysis, given the due date of submitting this manuscript, it was difficult to present results in this paper. However, hopefully during the conference, the authors will present the results and a handouts to the conference attenders.
References
- Buschbacher, R.J., (1986), Tropical Deforestation and Pasture Development, Bioscience Vol. 36, No. 1 Jan 1986
- de Gier, A., (1995), Your 7000 square meters, ITC Journal 1995-2
- Hamilton, A.C., (1994), Deforestation in Uganda, Oxford University Press
- Hoekman, D.H., (1995) , Remote Sensing Monitoring System for forest Management and Land Cover Change in Indonesia, (Project Proposal, unpublished)
- Lowell, K., (1994), A Fuzzy Surface Cartographic Representation For Forestry Based on Voronoi Diagram Area Stealing, Canadian Journal of Forest Resources, Vol. 24, pp 1970-1980.
- Patimena, L., (199), Monitoring Land Cover Change and deforestation Using Microwave and Optical Satellite Data in Conjunction with GIS, a Case Study from Jambi, Indonesia, Msc thesis
- weire, M.J.C. and Diajono A., (1994), Assessing the Accuracy of Natural Resource Data for Forest Land Assessment in Indonesia, Paper presented at the Symposium on Spatial Accuracy of Natural Resource Data Base, Williamsburg, Virgina.