| GISdevelopment.net ---> AARS ---> ACRS 1996 ---> Digital Image Processing |
Precise Geometric and
Radiometric Corrections of Spot Pan & XS Data For Land Use Monitoring
Peter Bitter, Priska
Haller
Dept. of Geography
University of Zurich - Irchel
Switzerland
Abstract Dept. of Geography
University of Zurich - Irchel
Switzerland
In view of identifying areas of major changes from the baseline of existing 1:10'000 land use maps compiled from aerial photography, SPOT Pan and XS data is being used. Since the area of interest consists mostly of hilly and rugged terrain, a precise correction of geometric and radiometric errors induced by terrain variations is important. While commercially available software can be used to correct geometric errors, a new physically-based model developed at the University of Zurich is employed to correct topographically induced illumination and atmospheric effects. The model accounts for direct, diffuse, and terrain irradiance. In a first step, the component and atmospheric effects. The model accounts for defect, diffuse, and terrain irradiance. Ina first step, the components and atmospheric a parameters are computed for flat surfaces using the 6S code. Then the components are computed for actual terrain surface using a DEM. The results are reflectance images for each of the panchromatic and the multispectral bands of the sensor. These images are then merged to obtain a multispectral reflectance image with the higher resolution of the panchromatic band.
Since this work is still in progress, the paper is limited to describing the approaches and procedures for pre-processing. No final assessment of the usefulness of the approach for land use monitoring at the desired scale can be given yet.
Introduction
The Forest and Land use Mapping Project (FOR-LUMP) prepared 1:10'000 land use maps for the whole of the Upper Mahaweli Catchment form 1987 aerial photography [TURNER]. The follow-up activities include attempts to regularly update the land use maps. Since acquisition and interpretation of new air photography is costly and time consuming, the use of satellite imagery is an obvious option. Earlier studies showed that satellite imagery can be reasonably used to identify land use changes at a scale of 1:100'000, if there is a good benchmark against which the imagery can be compared. However, the usefulness of satellite imagery considerably decreases in rugged terrain, mainly because of illumination differences [SRI LANKA SWISS REMOTE SENSING PROJECT. Additionally, there is no experience on updating large0scale land use maps with satellite imagery in Sri Lanka.
We are using SPOT Pan and XS scenes of the same overpass on 21 march 1993. They were preprocessed at level 1A (only detector normalization ) by SPOTIMAGE. The test site is located in the hill country of Sri Lanka and measures 10 by 16 kms (see Figs. 1&2). Elevations range from approx. 1000 to 2500 meters. A digital elevation model (DEM) with 10 m resolution has been generated by FORLUMP from 10 m contour maps. Horizontal visibility observations for several stations in the wider area have been supplied by the Sri Lanka Dept. of Metrology for the day of image acquisition.
Figure 1 Location of test site
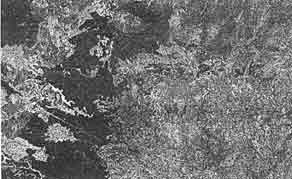
Figure 2 SPOT Pan image of test site, scale approx. 1:100000
A overview of all pre-processing steps can be found in Fig. 3.
Figure 3 Overview of Pre-processing applied to SPOT Pan & XS imagery
2. Geometric Corrections
It is well know that terrain-induced across-track distortions can also be found in optical satellite imagery [ITTEN]. In our test image with an incidence angle of 17.5o, the displacements could, in the worst case, amount to as much as 1000 meters or 100 pixels. It is therefore quite obvious that these distortions have to be rectified before the imagery can be overlaid on the DEM to perform the radiometric corrections. We used com-mercailly available software (PCI) to perform the geometric correction., The software ina first step models the satellite's attitude from ancillary data and adjusts distortions in ground control point coordinates. The actual rectification takes place in a second step. Where also the DEM is needed. Each scene (Pan & XS) has been geocoded individually to map geometry.
The results are somewhat disappointing:
Although we collected 60 GCP in each scene and deleted the worst 20, we received RMS errors of 80 and 86 meters in the Pan and XS scenes respectively. We attribute these rather large deviations to problem with eh maps which we used for GCP collection; they may partly stem from inaccuracies in the original stereo plotting, partly from paper distortions in the old map sheets which are available to us. Finding good GCPs was also difficult sometimes because many prominent features in the imagery were not present at the time of map compilation. An additional problem seems to be buried in a software but: the separate rectification of Pan and XS 1A images to map geometry results in an inexplicable shift between the two images when overlaid. This necessitated an additional image-to-image registration before the fusion can be performed.
3. Radiometric corrections
3.1 Computation of atmospheric parameters and irradiant components for horizontal surface
In a first step, we used the 6S code (Second Simulation of the Satellite Signal in the Solar Spectrum; [VERMOTE et al] to compute the atmospheric transmission and the direct and the diffuse irradiance components for horizontal surfaces (see Fig. 4). The procedure requires mea-surements of the aerosol optical thickness as an input variable. Since these are normally not available, estimates of the horizontal visibility at the time of the satellite overpass can be used as a proxy. Additional input data are required to describe the sensor and the spectral bands and the data and time of the satellite overpass. The user then has to selected from one of several atmosphere and aerosol models. We are using the tropical atmosphere and the continental aerosol model in this work. Since atmospheric conditions normally vary with elevation above sea level, he code has to be run for several altitude levels; the results will be interpolated between these levels. We decided to use levels 200 meters apart, starting from 1000 msl. The output from 6S are the direct, diffuse, and surround irradiants, the path radiance, the upward transmittance and the anisotropy in the for horizontal surface for each spectral band at each altitude level.
Figure 4 Irradiance components on horizontal surfaces
3.2. Radiometric correction of imagery
As a second step, the influence of the local topography on the target reflectance is estimated and corrected. Whereas the path radiance and the upward transmittance, depend on the thickness of the atmosphere between the surface and the sensor (i.e. the elevation of the target) only, the other components will be modified by the relative orientation of the target pixel. The direct and the diffuse irradiance depend on the angel between the normal on the surface and the sun ray direction, and the surround irradiance depends on the amount of surface that can be seen from a target pixel (i.e. a pixel in a valley ) bottom gets more light from its neighbors than one on a hill top). Furthermore, cast shadows from mountains have to be considered (through they are rare in the tropics)
The direct irradiant is computed by means of the cosine law from slope and aspect of the target pixel. A mask of cast shadows at the time of image acquisition is computed from the DEM to mark pixels which are not getting any direct irradiance. The amount of diffuse irradiance is estimated by the sky-view factor, which gives the proportion of a pixel's hemisphere which is not obstructed by ferrain.It varies from 0 (no sky visible) to 1 (completely horizontal plane or hilltop: no obstructions). To compute the sky-view factor, the elevation angle to the horizon is computed for a number of integrated over the full circle. To estimate the sur-round (or environement) irradiance, a terrain view factor is computed in an analogous way. The formulas and algorithms for above procedures can be found in {SANDMEIER}. However, one has to be aware that this approach neglects the irradiance of the reflecting surface itself, the distance and atmospheric transmittance between reflecting surface and target, and perhaps most significantly, the reflectance and the bi-directional distribution of reflectance of the reflecting surface. To know the latter, one ought to know the complete land cover of the test area, which in turn rendered the mapping of land cover by satellite imagery obsolete. In this sense, the currant approach is certainly an approximation of the real situation.
Finally, the Digital Numbers in the image are converted to scene radiances Lb by means of the calibration coefficients given by the distributor of the imagery, and the surface reflectance R is computed as follows:
| R = | Lb -
Lp ----------------- I * T |
R = Surface reflectance
Lb = scene radiance
Lp = path radiance
I = total irradiant (direct + diffuse + surround)
T = upward transmittance
4.Mergin of Pan and XS
After registering and resembling the XS image to the geometry and resolution of the geocoded Pan image, a multispectral image with 10 meters resolution can be created by means of data fusion. The standard approach is to transform the XS image from the RGB (Red, Green, Blue) to the HIS (intensity, Hue, Saturation) color space, to replace the intensity channel with the Panchromatic image, and finally to perform the reverse transformation to the RGB colour space. However, this does not work very well with SPOT imagery because there is very little correlation between the Pan and the XS3 (Infrared ) bands. A study [DARVISHEEFAT] compared several approaches and found a radiometric procedure to yield best results for vegetation (esp. forest) mapping. This procedure was initially developed by the Ditital Image and Remote Sensing Laboratory (DIRS) at the Rochester Institute of Technology [MUNECHIKA]. It is based on the overlap of the spectral responses of the sensor channels. First, a synthetic cannel SYN which represents the sum of spectral response overlaps of the XS bands with Pan is computed as follows:

The weights wi are w1 = 0.454
W2 = 0.546
W3 = 0.000
Second, the Panchromatic band is edge enhanced with a 5 x 5 average filter and its histogram adjusted to the synthetic band:
| a = | sSYN --------------- sPAN |
sSYN = standard deviation of synthetic band
sPAN = standard deviation of Pan banc
SYN = average of synthetic band
PAN = average of Panchromatic band
Finally, the merged (hybrid) bands are computed as follows:
| HYBi = XSi . | PANadj ---------------- SYN |
The result is a color image with 10 m resolution
5. Outlook
In the forthcoming months, we will compare the imagery with the digitized land use maps of the 1980s on screen and try to identify areas of major and use changes. Subsequent field work will show us, what type of land use changes can be seen, and how good the reliability of identification is. A comparison with standard with standard processed imagery is also planned to determine whiter the extra effort is really worthwhile
Acknowledgements
The authors wish to thank Dr. H. Manthrithilake, Mr. R. White and Mr. T. Senanayake of the Environment and Forestry Division of Mahaweli Authority for supporting this study with DEM and satellite image data, the Dept. Of Meteorology for providing atmospheric data, and Dr. S. Sandmeier of Zurich University for advising on the radiometric corrections.
References
- DARVISHSEFAT, AA (1995): Einsatz und Fusion von Multisensoraten
Satellitenbilddaten zun Erfassung von Waldinventurn (in German)
Remote sensing Series Vol 24, Dept. of Geography, University of Zurich - ITTEN, KI & P MEYER (1993): Geometric and Radiometric Correction
of TM Data of Mountainous Forested Areas
IEEE Transaction on Geoscience and Remote Sensing Vol. 31. No. 4 - Munechika, CK (1990): Merging Panchromatic and Multispectral Image
for Enhanced Image Analyis
MS thesis, Rochester Institute of Technology, NY USA - SANDMEIER, SR (1995): A Physically-Based Radiometric Correction
Model : Correction of Atmospheric and Illumination Effects in Optical
satellite data of rugged terran
Remote Sensing Series Vol. 26,Dept. of Geography, University of Zurich - SRI LANKA SWISS REMOTE SENSING PRO-JECT (1988): Final Report
Sri Lanka Studies Vol. 2, Dept. of Geography, University of Zurich - TURNER, STD & R White (1994): Geographical Information System
for natural resource management in South East Asia
Environment and Forest Conservation Division, Mahaweli Authority of Sri Lanka - VERMOTE et al (1994)L Second Simulation of the Satellite Signal in
the Solar Spectrum Signal in the Solar Spectrum (6S); Users guide
NASA GSFC, Greenbelt MD, USA - ZEE, D van der & JA Cox (1988): Monitoring in Moneragala
District, Sri Lanka with SPOT images
ITC Journal No 3, 1988