| GISdevelopment.net ---> AARS ---> ACRS 1996 ---> Digital Image Processing |
Multi spectral, Remotely
Sensed data compression method using neural networks
Junichi
Suzaki
Institute of Industrial Science, University of Tokyo,
7-22-1 Roppongi, Monato-ku, Tokyo, Japan
Eihan Shimizu
Department of Civil Engineering, University of Tokyo,
7-3-1 Hongo, Bujkyo-ku, Tokyo, Japan
Abstract Institute of Industrial Science, University of Tokyo,
7-22-1 Roppongi, Monato-ku, Tokyo, Japan
Eihan Shimizu
Department of Civil Engineering, University of Tokyo,
7-3-1 Hongo, Bujkyo-ku, Tokyo, Japan
In this research, we examined the feasibility of the use of Neural Networks (NN) for the compression of multi spectral Remote Sensing data. NN is used to reduce the dimensions of original data meanwhile keeping the information content as highly as possible. Firstly, we analyzed the theoretical background of NN in data compression and its relative merits with principal component analysis (pca) which is traditionally used for compressing huge data sets. Then, we compared an image using data compressed by NN with a natural color image . It was found that the image generated from the NN compressed data is more suitable for visual interpretation , because it contains more characteristic ics (information) of the original data.
Comparisons of both 1) the NN model with pca , and 2 ) an image created from NN compressed data with a natural color image show that the NN can be used successfully as data compression method.
1. Introdution
Multi spectral Remote Sensing data can be used for land classification. Two types of classification techniques exist: automated classification and visual interpretation. Visual interpretation is usually carried out based on a false color image generated by using three channels of multi spectral data. In general, multi spectral data contains more channels that is required for the false color image, and it results unused information (channels) of the original data. We discussed a method to generate an image which is capable to reflect all the channels of data. It requires the compression of multi channels into three channels. So far, there are a lot of researches about compression, most of which deal with pca. Some researches show that pca is useful to reduce the number of dimensions and to get new independent data meanwhile reflecting all the dimensions of original data. Contrary, others show that it is not so effective because of its restraint linear transformation.
In the study, NN models, a widely used data processing method, was applied because they are flexible to even non-linear data. First of all, a NN model suitable for data compression was constructed. Then, it was applied for Remotely Sensed data and the result was compared with pca's. Finally, we validated it as a data compression method by comparing an image compressed by NN with an original image.
2. Data Compression by NN
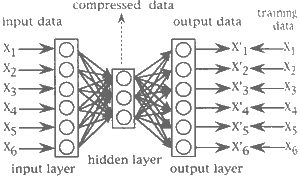
Multi-layered NN models have been widely used among NN models. The three-layered model, the simplest one for data compression, is shown in figure 1.

Figure 1 Identity mapping NN model for data-dimensional compression
It has as many units in the input layer as in the output layer, while it has less ones in the hidden layer. Input data are also used as training data and the model continues to modify both weight and offset parameters so that output data are closer to training data. This means that such models (e.g. presented on Figure 1) represent identity mapping.
But Funahashi1) proved that data recompressed by three-layered model (e.g. Figure 1) are inferior to ones recompressed by pca.
On the other hand, Irie2) showed that layered NN, whose units in the hidden layer are mote than ones in both the input layer are more than ones in both the input layer and the output layer (Figure 2), can be adaptive for almost all non-linear data set.

Figure 2 NN Model adaptive for non-linear data set
Thus we constructed a model, shown in Figure 3, by combining a model described in Figure 2 with a model linearly symmetric to it.

Figure 3 NN model for data-dimensional compression
This leads that the first three layers of the model functions to compress, while the last three layers functions to recompress data. We can use data of the second hidden layer as compressed data which should be superior to ones compressed by pca and has to reflect all channels of data.
3. Results
The Remotely Sensed data (LANDSAT 5 TM) used in our experiment describes and area (approximately 207 km2) in Bangkok. It consists of 480 lines and 480 pixels on screen. Six channels except thermal channel were used. Thermal channel was not used due to its peculiarity in terms of instantaneous field of view. The NN model (in Figure 3) was experimented. We used 480 training data sets (sampling ratio was about 0.2%). The necessary learning time was as much as 30,000 cycle. A natural color image was used as an original image to compare other images with during the work.
3.1 Comparision of NN with pca
There is a difference in meaning between data compressed by NN and ones by pca. So, we compared six dimensional data recompressed from three dimensional compressed data by NN with ones by pca in order to determine which is superior as a data -dimensional compression method. In the NN's case, output data were used as recompressed ones. On the other hand, data recompressed by pca were generated by multiplying three dimensional compressed data by inverse matrix which was used in pca transformation.
First, as a result of calculation of coefficient, the coefficient between original data and data recompressed by NN was 0.988, while pca's one was 0.962.
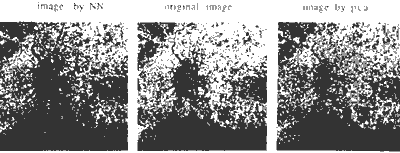
Next, we generated images by using data recompressed by NN and one by pca in the same way as a natural color image, and compared them with the original image (Figure 4). The image created from the NN recompressed data was much more alike to the original image that the image by pca.

Figure 4 images generated by using data recompressed by NN and by pca and an original image
Therefore, these facts demonstrates that the NN model in this research is superior to pca as a data -dimensional compression method.
3.2 Comparision of an image using data compressed by NN with an original image
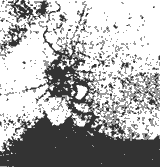
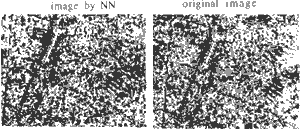
We generated an image by using three dimensional data compressed by NN (in Figure 5), then compared it with the original image (in Figure 4). It can be found that the image by NN shows such boundaries as a river and main roads original image. In the comparison. We focused on the area inside the airport (in Figure 6), because it is supposed to have almost the uniform and run length) were applied to effectively carry out the comparision.

Figure 5 Image generated using data compressed by NN

Figure 6 Areas inside an airport in an image by NN and an original image
The image kurtosis means the more data are concentrated around their mean. Shown in Table 1, the area by NN is relatively more homogeneous than the original one.
| kurtosis | |
| NN | 2.593 |
| original | 2.020 |
3.2.2 run length
We examined the sequence of pixel values along the directions of q =0o,45o,135o. As a result, both cases showed the most sequence at q =0o, and the result are presented in Table 2 The indicators (such as s.r.e., etc.) show that the area by NN is more homogeneous than the original one.
| s.r.e. | 1.r.e | g.1.n. | r.l.n. | r.p. | |
| NN | 0.936 | 1.444 | 4.980*104 | 1.232*104 | 0.899 |
| original | 0.958 | 1.287 | 5.164*104 | 1.279*104 | 0.931 |
| s.r.e. : short runs emphasis
l.r.e. : long runs emphasis g.l.n. : gray level nonuniformity r.l.n. : run length nonuniformity r.p. : run percentage | |||||
It demonstrates that the image compressed by NN is easier to visually interpret than the original one. The NN derived image loses les information from the original data, it is due to the NN method compresses all the channels of data into one three dimensional image reflecting more than three dimensional original data.
4. Conclusion
Based on the comparison, it can be concluded that the NN model constructed in out research is superior to pca as a data compression method. Moreover, images generated from data compressed by NN is more suitable for visual interpretation than its original image.
References
- K.Funahashi, On the Approximate Realization of Identity Mappings by Three-Layer Neural Networks, MBE88-174, pp109-114, 1988.
- B.Lrie and M.Kawato, Acquisition of Internal Representation by Multi-Layered Perceptrons, D-II, No. 8, pp1173-1178, 1990.
- M.Takagi and H.Shimoda, handbook of Image Analysis, University of Tokyo Presets, Tokyo, 1991.